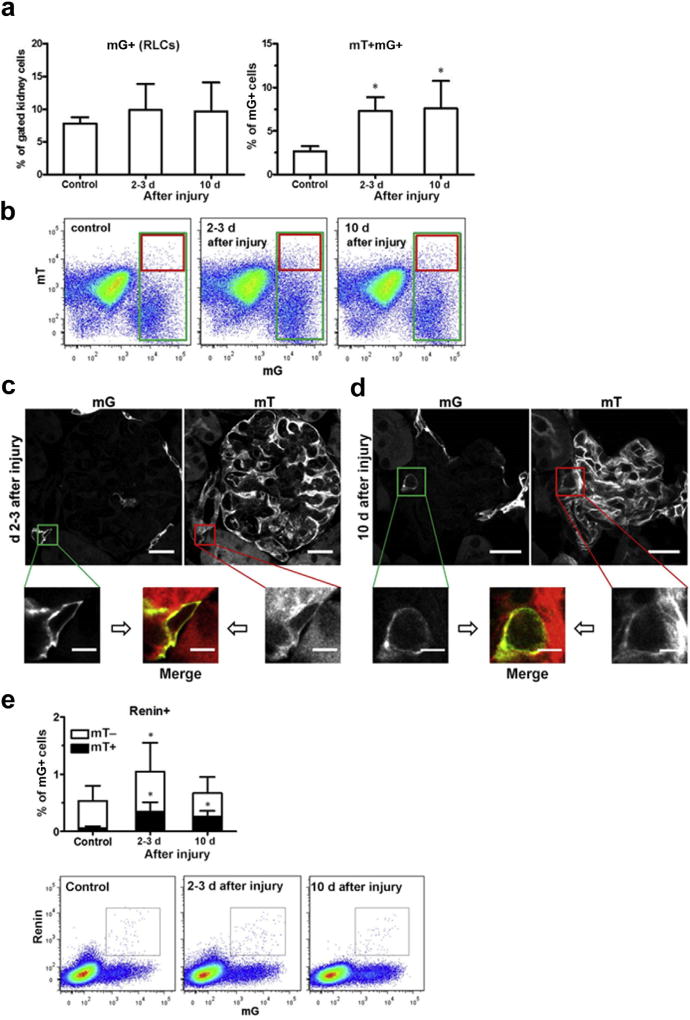
Figure 8. Neogenesis of renin lineage cells (RLCs) in mouse kidneys after mesangial cell injury.
In this model, the damage phase peaks at 2 to 3 days, and the mesangial proliferative regenerative phase peaks at day 10 after injecting an antimesangial antibody. (a) Quantification of RLCs (mG+, left panel) and de novo differentiated RLCs (mT+mG+, right panel) in the kidneys of healthy control and diseased mice (days 2–3 and day 10). (b) Representative flow cytometric analyses of the kidneys from healthy control (left panel) and diseased mice (days 2–3 and day 10, middle and right panels, respectively). (c) Representative confocal images of de novo differentiated RLCs (mT+mG+) in the kidney of diseased mice (days 2–3). (d) Representative confocal images of de novo differentiated RLCs (mT+mG+) in the kidney of diseased mice (day 10). Images from control animals are presented in Figure 5e. (e) Quantification of renin-positive RLCs and their distribution to de novo differentiated (mT+) and long-lived (mT−) subpopulations of RLCs (mG+) in the kidneys of healthy control and diseased mice (days 2–3 and day 10, upper panel) with representative flow cytometric analyses (lower panels). Bar = 20 µm (or 5 µm in zoomed images). Data are presented as mean ± SD; n = 9 to 10 per group; *P < 0.05 versus control (1-way analysis of variance). To optimize viewing of this image, please see the online version of this article at www.kidney-international.org.

