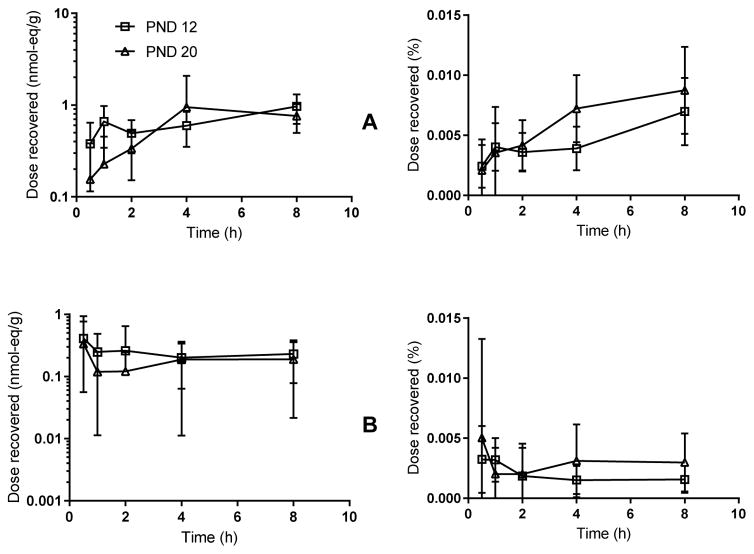
Figure 7.
Time-concentration curves for: (A) pup stomach contents and (B) pup liver. Left: sample concentrations in nmol-eq/g, Right: fraction of total dose recovered in the sample relative to dose administered to the dam. Pups nursed freely up until the time of tissue collection. N=3 litters per time-point, 2–3 males, 2–3 females per litter. No differences were seen between males and females.

