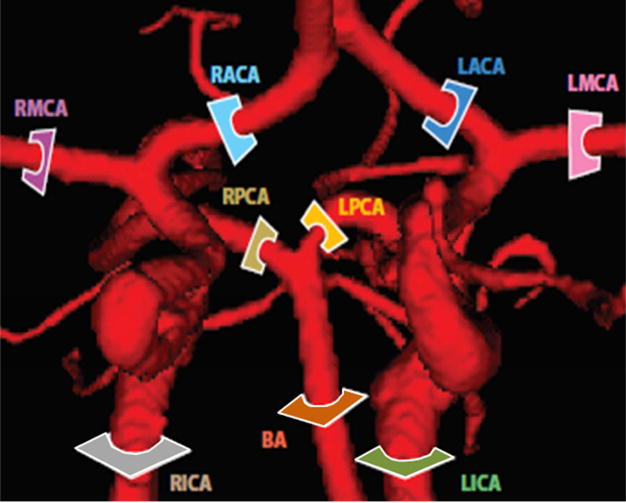
Figure. A2.

Comparison of regional blood flow measurement and subject-specific simulation using PC-MRA flow measurement. The color-coded slice plane is perpendicular to the longitudinal axis of a vessel segment showing where the measurement was made in the main cerebral arteries (BA, LICA, RICA, LACA, RACA, LPCA, RPCA, LMCA, and RMCA).
