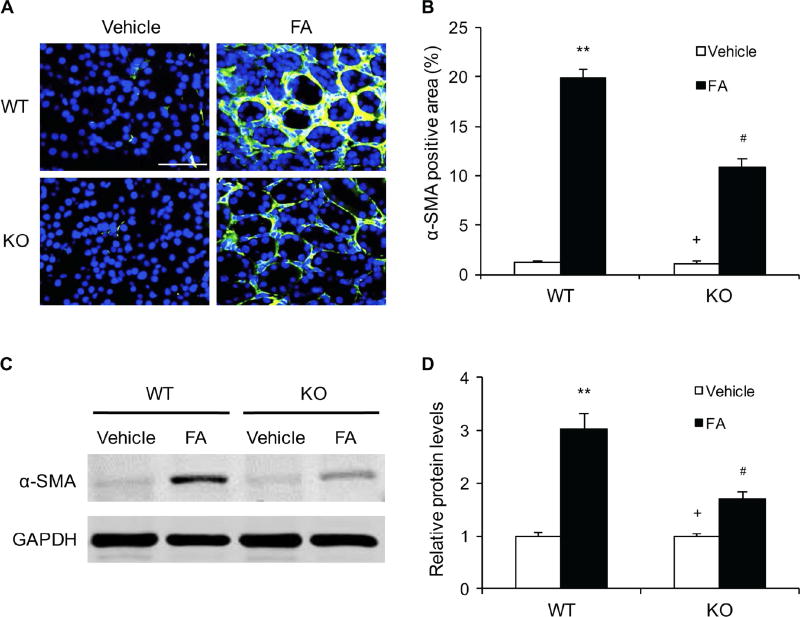
Figure 2. IL-4Rα Deficiency Inhibits Myofibroblast Formation in Folic Acid Nephropathy.
A. Representative photomicrographs of kidney sections stained for α-SMA (green) and counterstained with DAPI (blue). Scale bar, 50 μm. B. Quantitative analysis of α-SMA-positive area in kidneys. ** P<0.01 vs WT-Vehicle, # P <0.05 vs WT-FA, + P <0.05 vs KO-FA. n=6 in each group. C. Representative Western blots show the levels of α-SMA protein expression in the kidneys. D. Quantitative analysis of α-SMA protein expression in the kidneys. ** P<0.01 vs WT-Vehicle, # P <0.05 vs WT-FA, + P <0.05 vs KO-FA. n=6 in each group.

