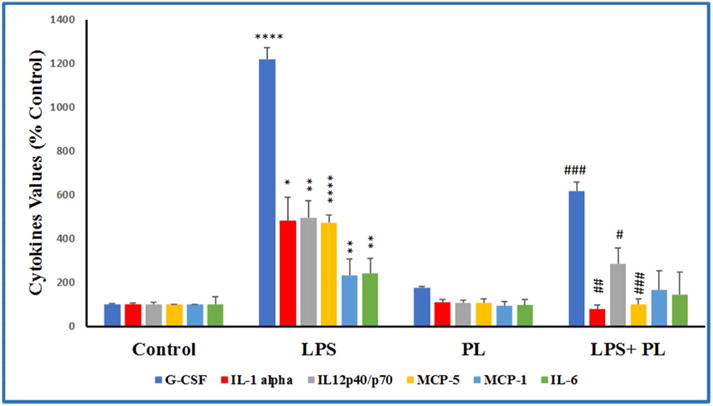
Fig. 5.

The effect of plumbagin on cytokines release in LPS-activated microglial cells. The normalized data showed cytokines expression in four sets of experimental cells supernatants; DMSO-treated control cell, PL-treated cells (2 μM), LPS-stimulated cells (1 μg/mL), and LPS + PL-treated cells (1 μg/mL + 2 μM, respectively). Three independent studies were performed with n = 6, and the intensities were expressed as % control. The significance of the difference was determined by unpaired t-test between resting vs. LPS-activated cells (*), as well as LPS-treated vs. LPS + PL-treated cells (#). Significance is considered at * p < 0.05, ** p < 0.01, **** p < 0.0001, # p < 0.05, ## p < 0.01 ### p < 0.001.
