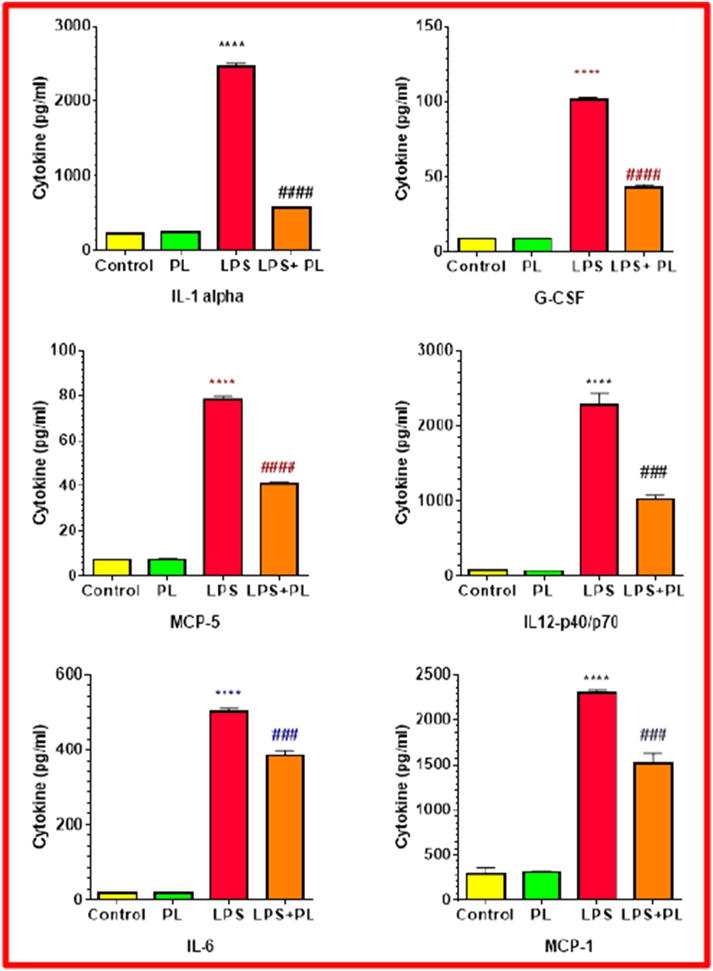
Fig. 6.

The effect of plumbagin on cytokine release levels in LPS-activated BV-2 microglial cells. Cytokines quantification was determined (pg/mL) in the supernatant of DMSO treated control cell, PL–treated cells (2 μM), LPS–stimulated cells (1 μg/mL), and LPS-PL co-treated cells. Two independent studies were performed with n = 6, and the significance of the difference was determined by unpaired t-test between resting vs. LPS-activated cells (*), as well as LPS-treated vs. LPS + PL-treated cells (#). Significance is considered at **** p < 0.0001, ### p < 0.001, and #### p < 0.0001.
