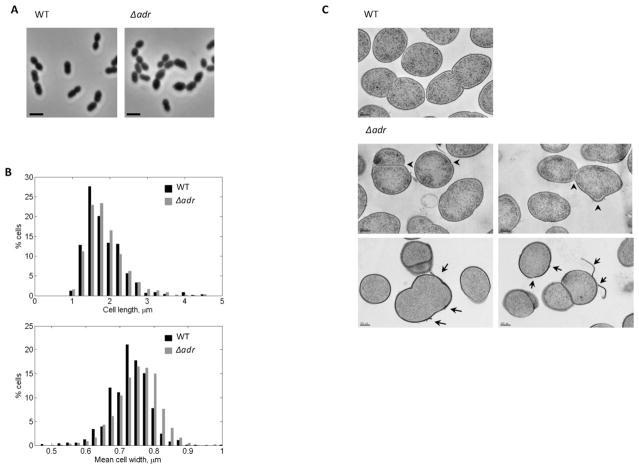
Figure 4. Morphological analysis of pneumococcal Δadr cells.
A. Phase contrast microscopy images of WT and Δadr exponentially growing cells in CY medium. Scale bars, 2 μm.
B. Distribution of the length (upper panel) and width parameters (lower panel) of Δadr cells compared to WT cells. Measurements were performed on at least 700 cells based on phase-contrast images using MicrobeTracker.
C. Transmission electron micrographs of thin sections of Δadr cells harvested at mid-exponential growth phase. Scale bars, 200 nm. Arrow heads indicate defective septal initiation sites and arrows point to cell wall peeling and destructurations.

