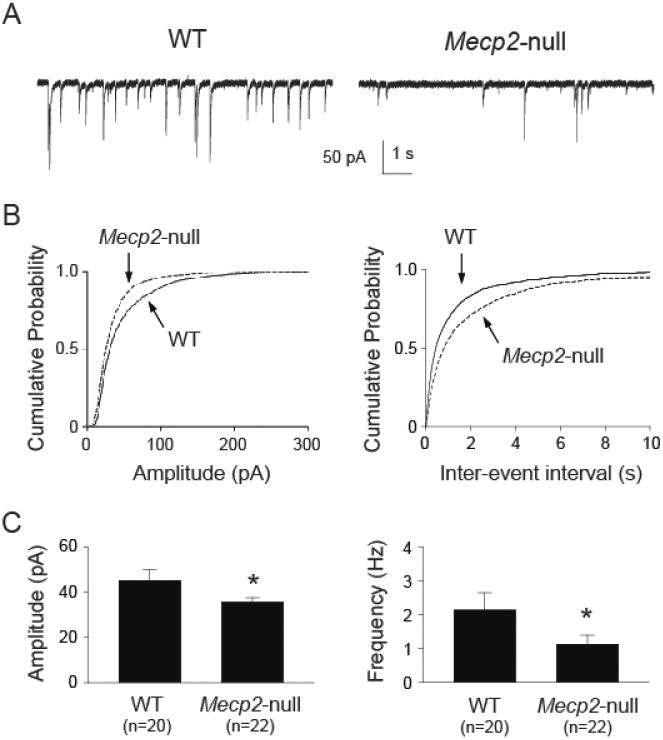
Figure 1.

Mecp2-null mice had reduced sIPSC amplitude and frequency in the NTS. A. Example traces of sIPSC recorded from one wild type (WT) and one Mecp2-null mouse. B. Cumulative probability plot from all recorded neurons showing a leftward shift in sIPSC amplitude (left), suggesting reduced sIPSC amplitude in Mecp2-null mice. There was a rightward shift in inter-event interval cumulative plot (right), suggesting a reduction in sIPSC frequency. C. Group data showing reduced mean sIPSC amplitude (left) and frequency (right). *, p < 0.05 Mecp2-null vs. WT (t-test).
