
Figure 3.
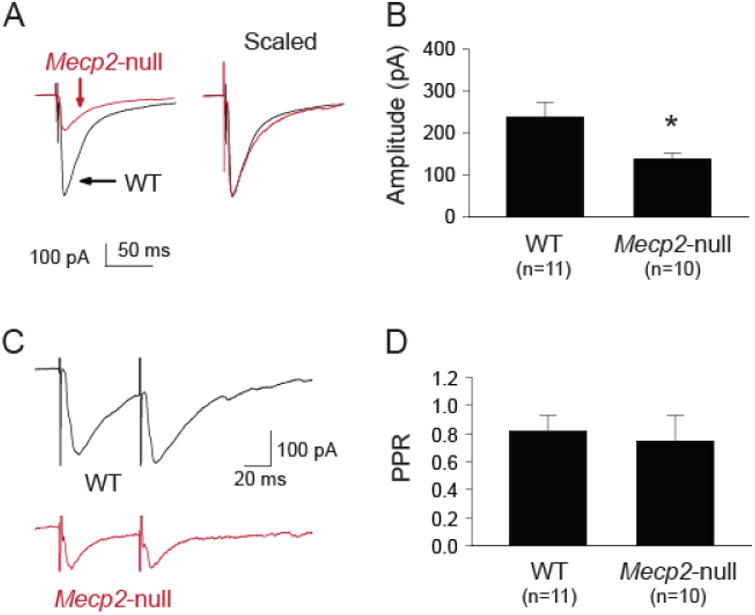
Mecp2-null mice had reduced eIPSC amplitude but not paired-pulse ratio in the NTS. A. Example traces of NTS-evoked IPCSs from one WT and one Mecp2-null mouse. Left, traces shown as their relative amplitude; Right, traces scaled to the same peak amplitude. B. Group data showing that the eIPSC amplitude was significantly smaller in neurons from the Mecp2-null mice. C. Example traces of NTS-evoked paired IPSCs from one WT and one Mecp2-null mouse. D. Group data showing similar paired-pulse ratio (60 ms inter stimulus interval) between the two groups, suggesting a postsynaptic mechanism mediating the reduced IPSC amplitude in Mecp2-null mice. *, p < 0.05 Mecp2-null vs. WT (t-test).