
Figure 6.
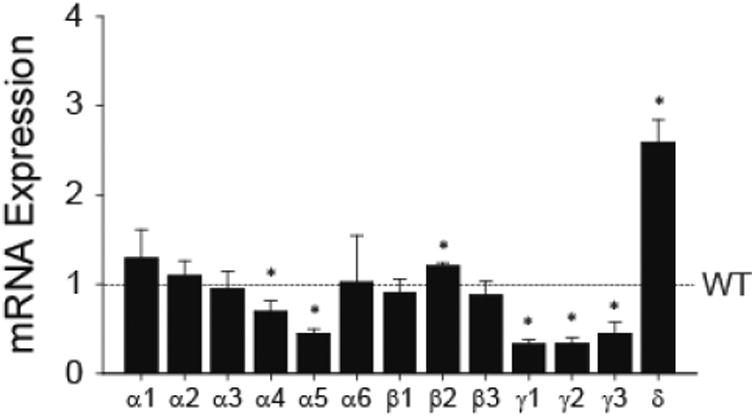
GABAA-R subunit mRNA expression level in the NTS. All data were normalized to expression level of the WT (dotted line). N = 4 in each group. *, p < 0.05 vs. WT (t-test on data before normalizing to WT).
Official websites use .gov
A
.gov website belongs to an official
government organization in the United States.
Secure .gov websites use HTTPS
A lock (
) or https:// means you've safely
connected to the .gov website. Share sensitive
information only on official, secure websites.
GABAA-R subunit mRNA expression level in the NTS. All data were normalized to expression level of the WT (dotted line). N = 4 in each group. *, p < 0.05 vs. WT (t-test on data before normalizing to WT).