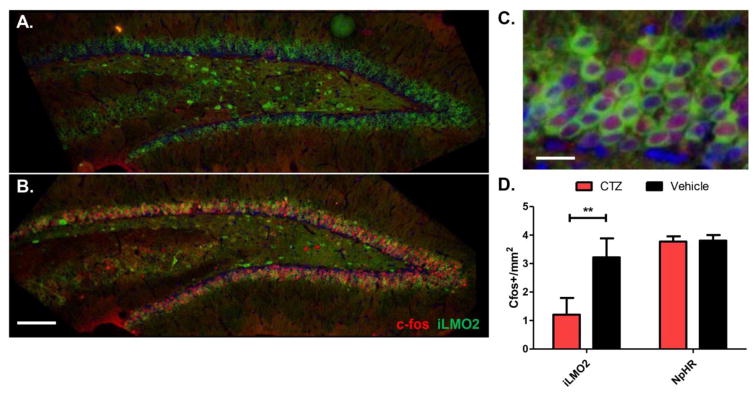
Figure 3. C-fos expression in the DG is reduced in animals treated with CTZ.
c-fos expression (red) after CTZ treatment (A) is reduced compared to vehicle-treated animals (B) Scale bar: 100μm. (C) c-fos expression in vehicle treated animals co-localizes with iLMO2 expression (green). Blue: DAPI. Scale bar: 10μm. (D) CTZ treated animals have significantly reduced levels of c-fos in the DG on average compared to vehicle treated animals (*p<0.01, n=12 images per group, Mann-Whitney test). CTZ had no effect in halorhodopsin expressing control animals. Error bars indicate SEM.

