Table 2.
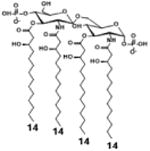
Structure-activity relationships of Lipid A analogs binding to TLR4.
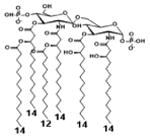
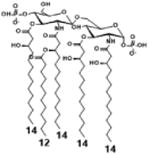
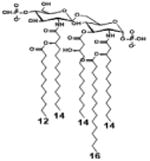
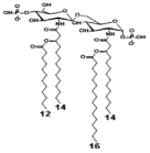
| 2 a) TLR4 activity as a function of number and distribution of acyl chains | ||||||
|---|---|---|---|---|---|---|
|
|
|
|
|
||
| Description | Lipid A [Benchmark] Compound 2 | Penta-acylated Lipid A | Penta-acylated Lipid A | Tetra-acylated Lipid A | Lipid IVA Compound 1 | |
| NF-κB | Activation | +++++ | ND | +++++ | ++++ | ND |
| MyD88 | TNF-α | +++++ | ND | ++ | ++ | N/A |
| IL-1β | +++++ | + | +++ | ++ | N/A | |
| IL-8 | +++++ | ++ | +++++ | +++++ | N/A | |
| TRIF | G-SCF | +++++ | ND | ++ | + | N/A |
| RANTES | +++++ | + | ++ | ++ | N/A | |
| MCP-1 | +++++ | + | +++ | +++ | N/A | |
| Conditions | Lipid A analog cone. | 100ng/mL | 100ng/mL | 100ng/mL | 100ng/mL | 100ng/mL |
| Cell type | THP-1 | THP-1 | THP-1 | THP-1 | THP-1 | |
| Reference | [9] | [9] | [9] | [9] | [29] | |
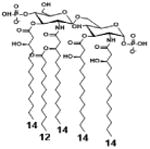
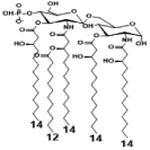
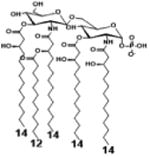
| 2 b) TLR4 activity as a function of number and distribution of phosphate substituents | ||||
|
|
|
||
| Description | Bis-phosphorylated Lipid A [Benchmark] | 4′- phosphorylated Lipid A | 1- phosphorylated Lipid A | |
| NF-κB | Activation | ++ | ++ | +++ |
| Conditions | Lipid A analog cone. | 100ng/mL | 100ng/mL | 100ng/mL |
| Cell type | HEK293 hTLR4/hMD-2 | HEK293 hTLR4/hMD-2 | HEK293 hTLR4/hMD-2 | |
| Reference | [32] | [32] | [32] | |
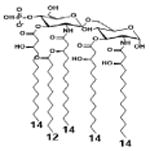
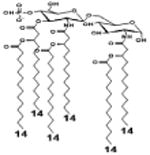
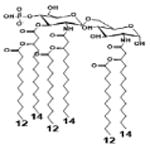
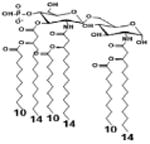
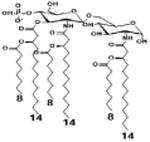
| 2 c) TLR4 activity as a function of secondary acyl chain length | ||||||
|
|
|
|
|
||
| Description | Secondary acyl chain length | 4′- phosphorylated Lipid A [Benchmark] | 14-14-14 | 12-12-12 | 10-10-10 | 8-8-8 |
| MyD88 | TNF-α | + | + | +++ | ++ | ND |
| IL-1β | + | ++ | ++ | +++++ | ND | |
| Conditions | Lipid A analog conc. | 10μg/mL | 10μg/mL | 10μg/mL | 10μg/mL | 10μg/mL |
| Cell type | Human whole blood | Human whole blood | Human whole blood | Human whole blood | Human whole blood | |
| Reference | [30] | [30] | [30] | [30] | [30] | |
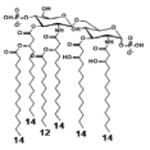
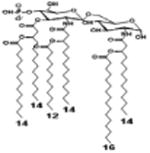
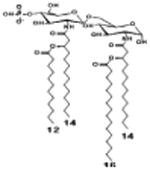
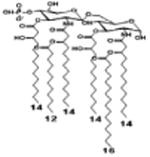
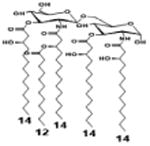
| 2 d) TLR4 activity as a function of combined structural changes | ||||||
|
|
|
|
|
||
| Description | Lipid A [Benchmark] Compound 2 | Hexa-acylated, monophosphorylated Lipid A | Tetra-acylated, monophosphorylated Lipid A | Hexa-acylated, monophosphorylated Lipid A | Penta-acylated Lipid A without phosphates | |
| Modification enzymes involved | Benchmark | PagP, PagL, LpxE | LpxE, PagL, LpxR | LpxM, LpxE, PagP | LpxM, LpxE, LpxF | |
| VF-κB | Activation | +++++ | +++++ | +++++ | ++++ | ++ |
| MyD88 | TNF-α | +++++ | ++ | + | + | ND |
| IL-1β | +++++ | +++ | + | + | ND | |
| IL-9 | +++++ | +++++ | ++++ | +++++ | +++ | |
| TRIF | G-SCF | +++++ | ++ | + | ND | ND |
| RANtes | +++++ | ++ | + | + | ND | |
| MCP-1 | +++++ | ++ | + | ++ | + | |
| Conditions | Lipid A analog conc, | 100ng/ml | l00ng/mL | 100ng/mL | 100ng/mL | 100ng/mL |
| Cell type | THP-1 | THP-1 | THP-1 | THP-1 | THP-1 | |
| Reference | [9] | [9] | [9] | [9] | [9] | |
‘+’ symbols correspond to the signaling output intensity. All activity intensities are normalized with respect to the benchmark (Column 1, Tables (2a, 2b, 2c, 2d)). The greater the number of ‘+’ symbols, the greater the signaling intensity.
Signaling intensity of ‘ND’ corresponds to baseline/ negligible activity output
N/A: not available
