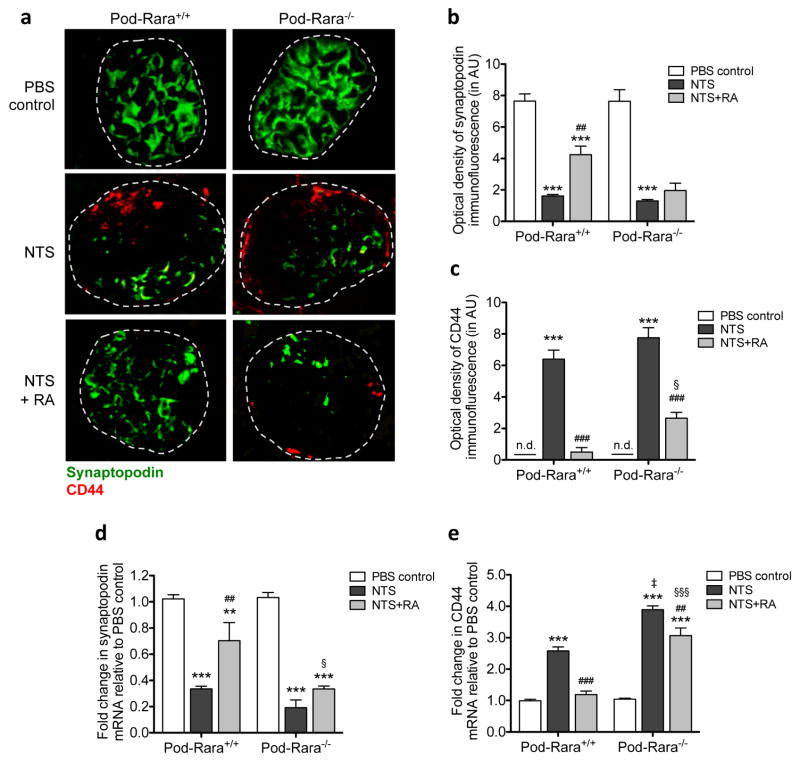
Figure 2. Role of RA and RARα in the expression of podocyte differentiation and injury markers.
(a) Representative images of synaptopodin (green) and CD44 (red) immunofluorescence are shown (magnification: x400, scale bar: 50μm). (b, c) Quantification of immunofluorescence optical density for synaptopodin (b) and CD44 (c) are shown. AU, arbitrary units. n.d., not detected. (d, e) Real-time PCR analysis for synaptopodin (d) and CD44 (e) from isolated glomeruli are shown. (**P<0.01 and ***P<0.001 compared to respective PBS-injected control; ##P<0.01 and ###P<0.001 compared to respective NTS-injected mice; ‡P<0.001 compared to NTS-injected Pod-Rara+/+; §P<0.05 and §§§<0.001 compared to NTS+RA Pod-Rara+/+. n.d., not detected, n=6 in each group).

