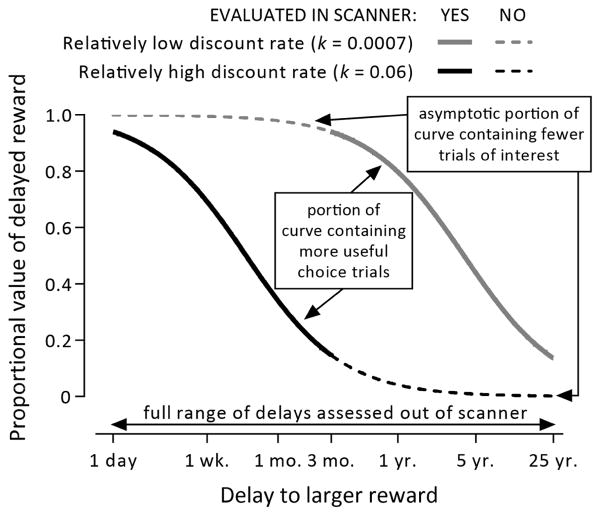
Figure 1.
Examples of two indifference curves representing discount rates that are within the range of typical values. The shape of the curve is similar across discount rates, but is shifted left or right depending on the specific rate. After an individual’s discount rate is determined by evaluating the full range of delays in an out-of-scanner task, the Individualized Discounting Task only assesses the portion of the curve for each participant (solid lines) that is most relevant to resolving the discount rate without assessing the asymptotic portions of the curve that are less useful (dashed lines).

