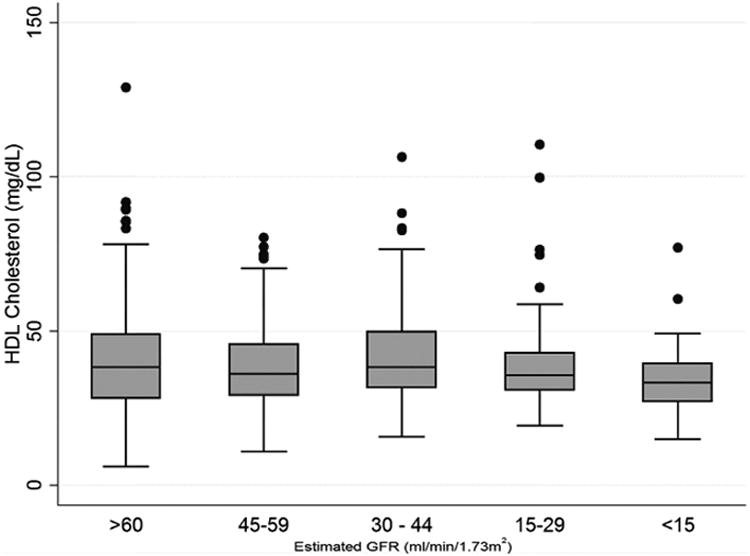
Figure 1. Serum HDL cholesterol concentrations in the Seattle Kidney Study cohort.

Box and whisker plots illustrate the serum high-density lipoprotein (HDL) cholesterol concentrations for each range of estimated glomerular filtration rate (GFR) noted. Top, middle, and bottom of boxes are 75th, 50th, and 25th percentile respectively, whiskers illustrate the range with outliers (greater than 1.5x the interquartile range from the median) shown as circles.
