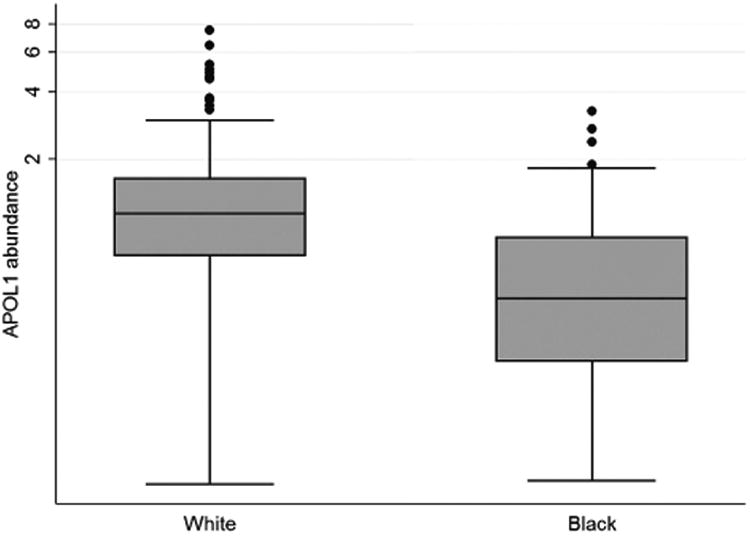
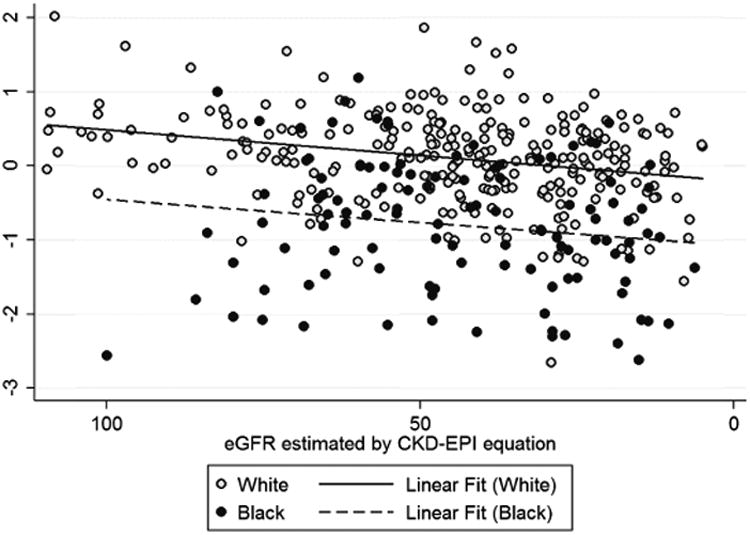
Figure 4. HDL-associated apoL1 in blacks and whites.


Box and whisker plots are shown for apolipoprotein L1 (apoL1) in high-density lipoprotein (HDL) for self-identified blacks and whites (A). Correlation between apoL1 in HDL and estimated glomerular filtration rate (eGFR) is shown for the Seattle Kidney Study (SKS) population, with the results of linear regression shown for blacks (dotted line) and for other races (solid line) (B).
