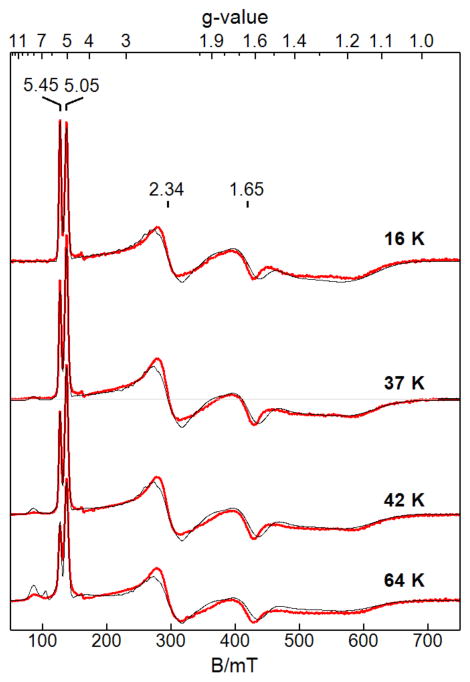
Figure 6.
EPR spectra (red) and simulations (black) of [NiII(OH)FeIII]+ at the temperatures listed, showing changes in the relative intensities of the signals (g = 5.45, 5.05, 2.34, 1.65) from the SC = 3/2 state and growth of the g = 8 signal from the SC = 5/2 state. Microwave parameters: 9.663 GHz, 0.2 mW, B1 ⊥ B. The simulations matched the temperature dependence of the signals and used a concentration that was in quantitative agreement with that measured for the complex.

