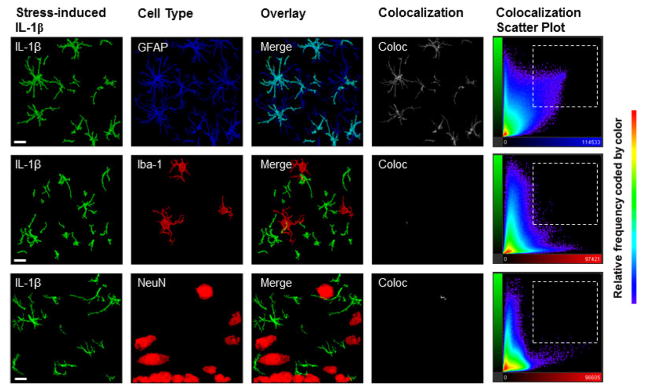
Figure 5. IL-1β signal is colocalized with GFAP, and not with Iba-1 or NeuN, in the dorsal hippocampus in stressed and non-stressed animals.
Representative images from the DH acquired at 63X (scale bar presented is 10μm) show colocalization of IL-1β with GFAP, Iba-1, and NeuN. Because we did not detect any differences in colocalization between stressed and non-stressed rats, all images here are taken from animals that received stress exposure. Colocalization panels (white, labeled ‘Coloc’) show Imaris-generated image of colocalized voxels in each Z stack image presented. Colocalization scatter plots show the signal intensity for each voxel in the Z stack. Specifically, color of each point represents the frequency, the Y axis represents IL-1β signal (Alexa-488) intensity, and the X axis represents GFAP (Alexa- 405), Iba-1 (Alexa- 568), or NeuN signal (Alexa- 568) intensity, respectively. In the top panel, the colocalization scatter plot between IL-1β and GFAP shows a high proportion of voxels that were high in both IL-1β and GFAP signal (selected region), and a high observed correlation, r = 0.3997, demonstrates that for any given voxel, as IL-1 signal increased, GFAP signal was also likely to increase. In contrast, scatter plots for both IL-1β with Iba-1 and IL-1β with NeuN show a high proportion of voxels that were high in only IL-1β or Iba-1 and NeuN signal, respectively (outside of selected region). In addition, there was a lower correlation for the IL-1β and Iba-1 signal, r = 0.1915, and IL-1β and NeuN signal, r = 0.0373, suggesting a much weaker relationship than that with GFAP.

