Figure 2.

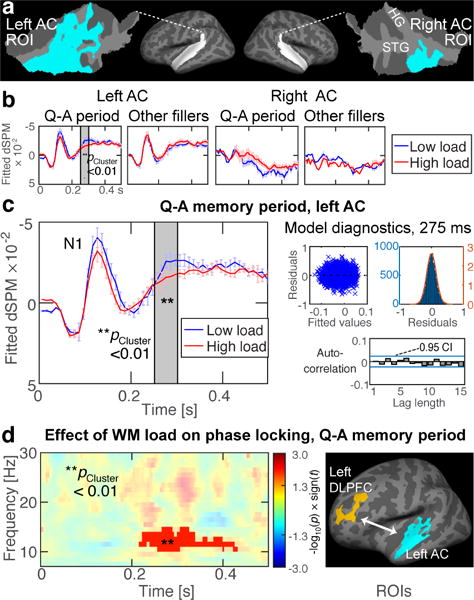
Effect of WM load on AC responses to irrelevant “filler” sounds and frontal–AC connectivity. (a) AC regions-of-interest (ROI) (Huang et al., 2013) depicted atop flattened patches of superior temporal cortex. (b, c) GLME-modeled responses to filler sounds during low vs. high WM load, during active “Q–A periods” vs. passive periods (i.e., “other fillers”). In the left AC ROI, high WM load significantly suppressed negative activations to filler sounds. This occurred during the Q–A periods, 250–300 ms after sound onset (gray shading). No significant effects were observed in other comparisons. Error bars reflect the standard error of the mean, corrected for autocorrelations. The vertical axes (“fitted dSPM”) reflect GLME-modeled values in arbitrary statistical units. (c) GLME diagnostics are shown at the within-cluster peak time point (275 ms). (d) High WM load enhanced alpha-band phase locking between the left DLPFC and AC ROIs (Huang et al., 2013) at around 200–400 ms after filler sounds (p<0.01, cluster-based randomization test). The timing is consistent with the suppression of sound-evoked responses in the left AC, shown in panel c.
