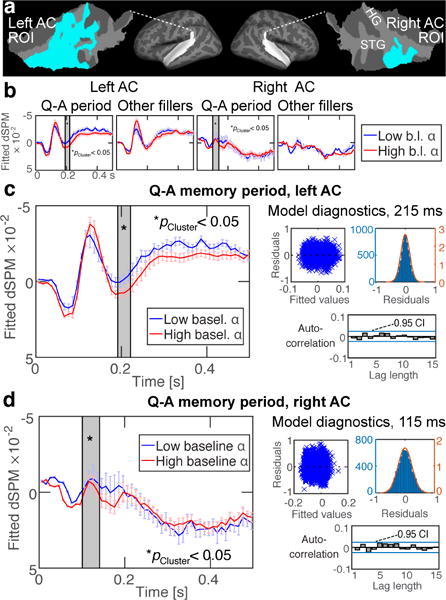
Figure 4.

Correlation between AC activations and pre-stimulus alpha power. (a) Regions-of-interest (ROI) depicted in flattened patches of superior temporal cortex. The ROIs were determined based on a previous study (Huang et al., 2013). (b, c, d) GLME results. High pre-stimulus alpha power correlated with suppression of post-stimulus negative activations to irrelevant “filler” sounds during the Q–A periods (c) in the left AC at 190–220 ms and (d) in the right AC at 100–140 ms (significant clusters shaded with gray). No significant effects were observed for filler sounds during the non-maintenance periods. The respective GLME diagnostics are shown for the within-cluster peak-effect time points. Error bars reflect the standard error of the mean, corrected for autocorrelations. The vertical axes (“fitted dSPM”) reflect GLME-modeled values in arbitrary statistical units.
