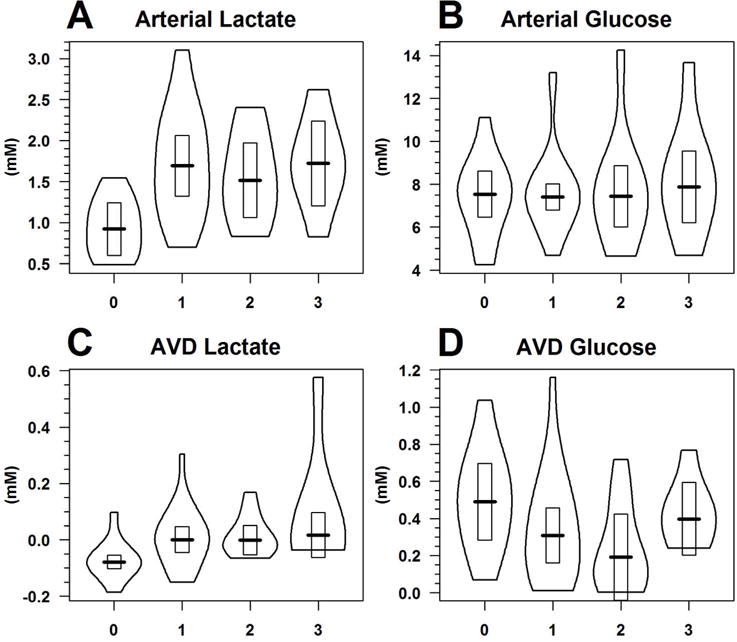
Figure 1.

Violin plots of (A) arterial lactate, (B) arterial glucose, (C) AVD lactate, and (D) AVD glucose over the 3 hour lactate supplementation infusion study, where hour 0 summarizes baseline metabolite concentrations before starting the infusion. The outside border of the violin plot is an estimate of the distribution of the data; the dark horizontal line the 20% trimmed mean; and the rectangle the 95% confidence interval of the trimmed mean.
