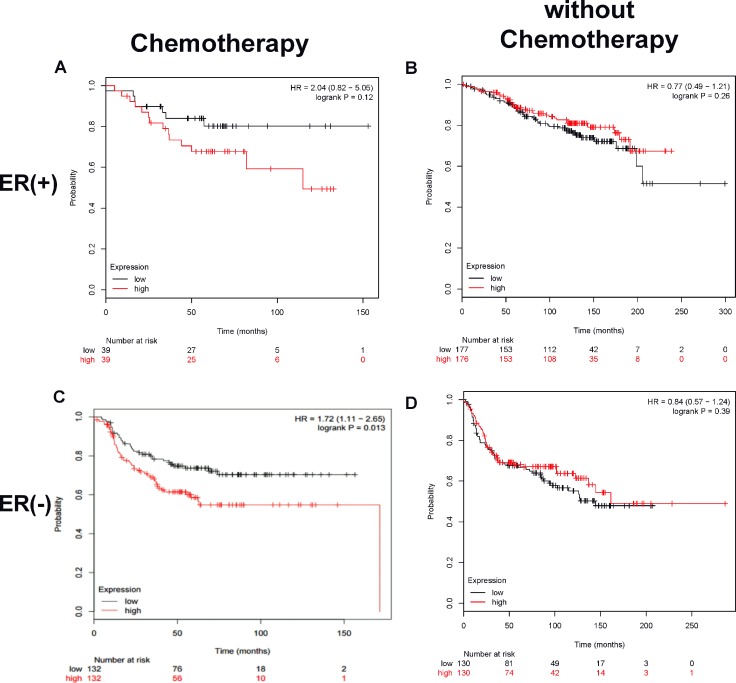
Figure 6. A high tumor CUL4A expression correlates to low survival in breast cancer patients treated with chemotherapy.
Kaplan–Meier plot analysis of survival curves by tumor CUL4A expression levels (low or high), estrogen receptor and chemotherapeutic status was carried out using public datasets as described in the Methods. Panels A and B are ER+ tumors treated with or without chemotherapy, respectively. Panels C and D are ER− tumors treated with or without chemotherapy, respectively. The red line devotes the high CUL4A expression tumors and the black line, low CUL4A expression tumors. The hazard ratio (HR) value and log rank p value are indicated in each panel.

