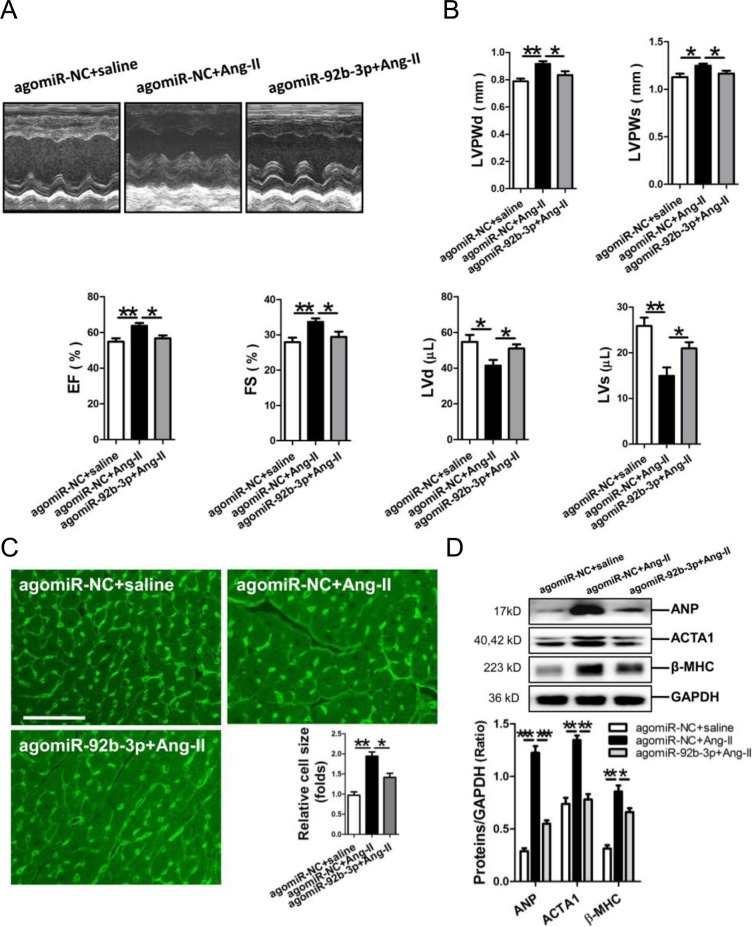
Figure 2. Phenotype of cardiac hypertrophy of Ang-II-infused mice with enforced expression of miR-92b-3p.
(A) Representative echocardiographs of mouse hearts. (B) The representative variables of echocardiograph assay in mice, including LVPWd, LVPWs, LVd, LVs, EF and FS. (C) WGA staining assay of the myocardium of Ang-II-infused mice with enforced expression of miR-92b-3p. The scale bar was 50 μm. (D) Expressions of ANP, ACTA1 and β-MHC in mouse myocardium by Western blot assay. Data are shown as mean ± sem, *p < 0.05, **p < 0.01, ***p < 0.001. N = 6–8.

