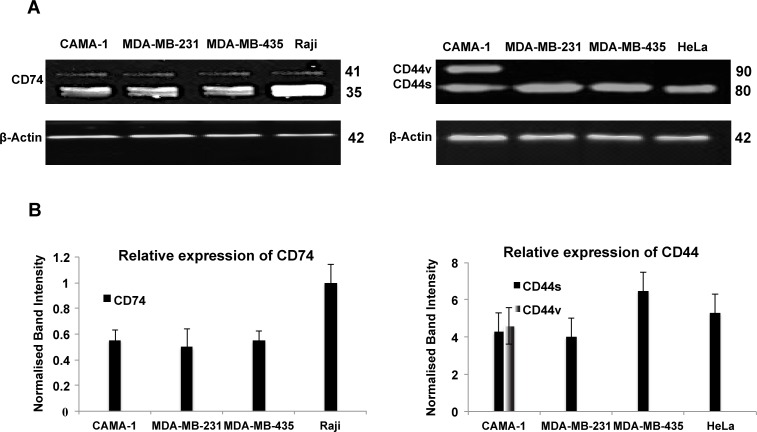
Figure 3. Western blot analysis of CD74, CD44 and β-actin expression in the CAMA-1, MDA-MB-231, MDA-MB-435 and Raji cells.
(A) Primary monoclonal antibodies Poly6221 (anti-β-actin as loading control), By2 (anti-CD74) and 156-3C11 (anti-CD44) were used. β-actin was detected at a molecular weight of 42 kDa; CD74 isoforms were detected at molecular weights 35 and 41 kDa, whereas CD44 isoforms were detected at molecular weights 80 and 90 kDa. (B) CD74 and CD44 levels are normalized against β-actin. To account for the difference in protein loading during the experiment, the percentage of expression was calculated after the intensity of each band was adjusted according to its respective β-actin band intensity using the Image Studio Lite software (LI-COR Biosciences). Figures depict representative samples from triplicate experiments displayed as composites of multiple Western blots.

