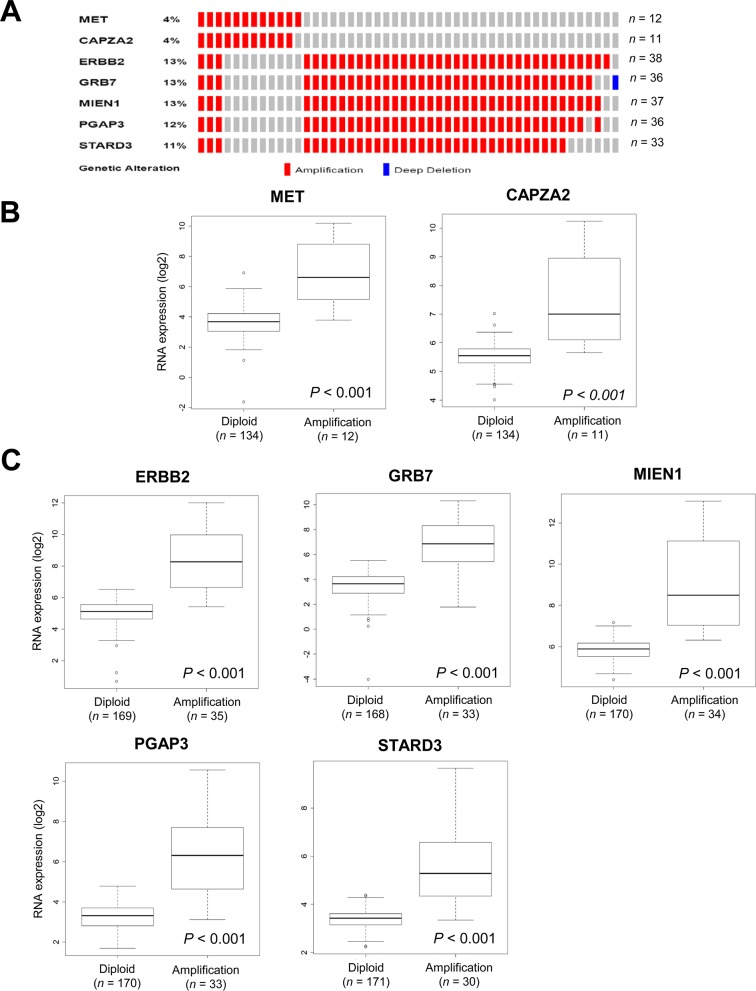
Figure 3. Validation of CNAs and gene expression of genes co-amplified with MET or ERBB2 in TCGA data.
(A) OncoPrint of CNAs in CAPZA2 and genes co-amplified with ERBB2 in 295 GC samples based on TCGA data [16]. (B, C) Box plot showing the association between their mRNA levels and gene amplification. The horizontal line within the box indicates the median, boundaries of the box indicate the 25th and 75th percentile, and the whiskers indicate the highest and lowest values of the results. OncoPrint was generated using the cBioPortal (http://www.cbioportal.org/). Statistical differences between the two groups were assessed using the Mann-Whitney test. The number of patients for each group (in parentheses) is provided.

