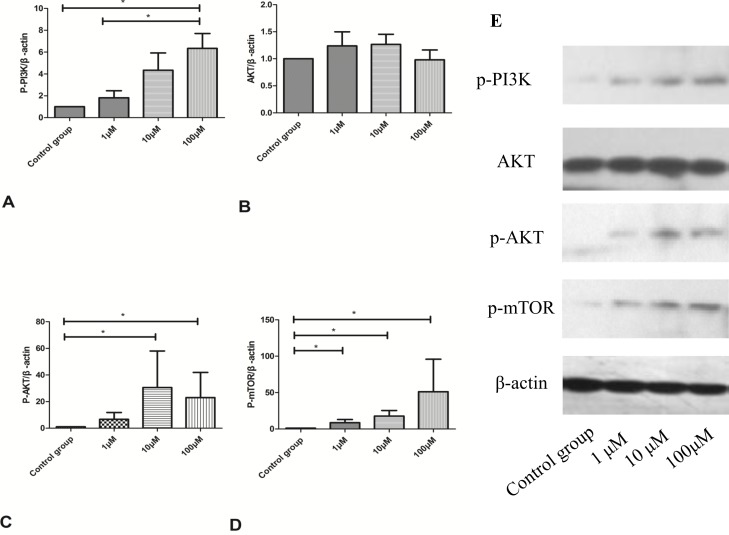
Figure 10.
(A) Quantification of western blots for p-PI3K expression of activated PSCs after 72h with CoQ10 treatment compared to control group (*: P<0.05. N=3). (B) Quantification of western blots for AKT expression of activated PSCs after 72h with CoQ10 treatment compared to control group (N=3). (C) Quantification of western blots for p-AKT expression of activated PSCs after 72h with CoQ10 treatment compared to control group (*: P<0.05. N=3). (D) Quantification of western blots for p-mTOR expression of activated PSCs after 72h with CoQ10 treatment compared to control group (*: P<0.05. N=3). (E) Western blotting analysis for PI3K/AKT/mTOR signaling pathway proteins expression of activated PSCs were performed after 72h with CoQ10 treatment.

