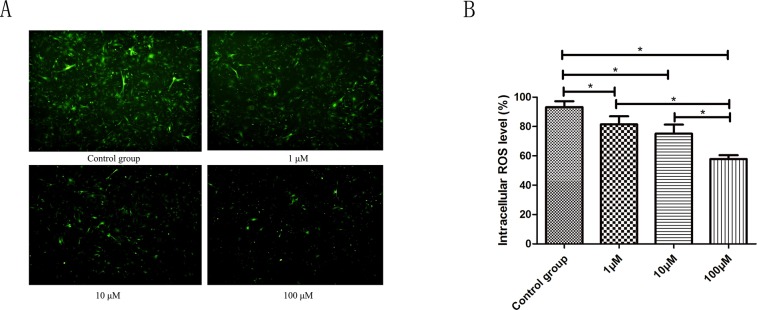
Figure 5.
(A) ROS levels were tested using fluorescence microscope by the DCFH-DA fluorescent probe. A significant decrease in ROS positive cells was observed after 72 h exposure to 1.0μM, 10μM, 100μM CoQ10 as compared to the control, respectively. (B) ROS levels were tested using flow cytometry by the DCFH-DA fluorescent probe. There were significant differences between CoQ10 treated group and control group for ROS level of PSCs (P<0.001) (*: P<0.05. N=3).

