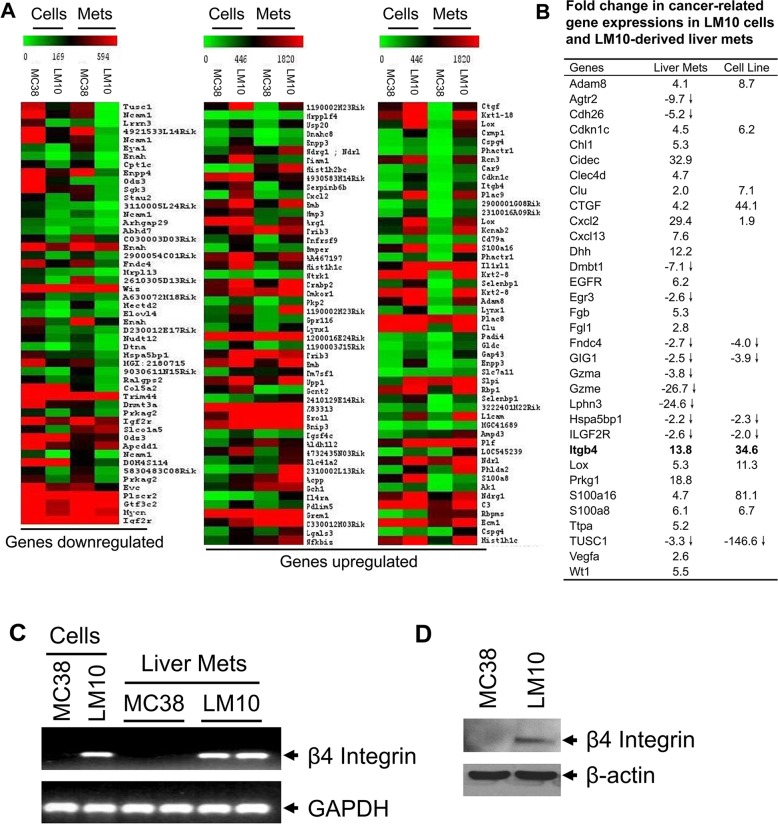
Figure 2. Gene expression profile analyses.
(A) Showing differentially-expressed gene profiles both in LM10 cells or corresponding liver metastasis tissues with at least a 2-fold change (>2 or <2) indicated by colored bars (green: down-regulated and red: up-regulated), when compared to MC38 counterparts. (B) Relative fold changes of upregulated or downregulated genes in LM10 cells and corresponding liver metastases compared to parental MC38 cells and corresponding liver metastases, respectively. (C) The mRNA expression of β4-integrin was increased in LM10 cells and corresponding liver metastases. The mRNA levels of β4-integrin were detected by RT-PCR. PCR products were analyzed by agarose gel electrophoresis. (D) Western blot analysis for protein expression of β4-integrin was performed using lysates prepared from parental MC38 and LM10 cells.

