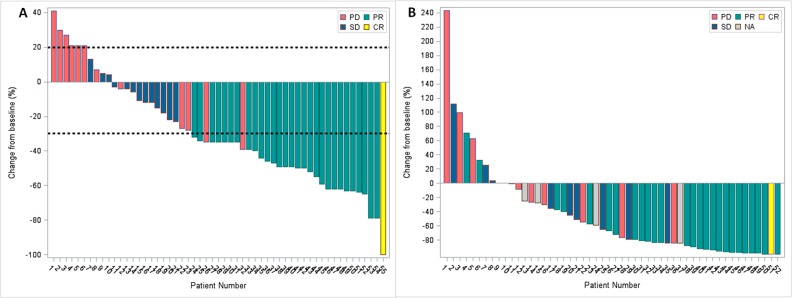
Figure 1. Waterfall plots, the color keys indicate the best overall response by blinded independent review.
(A) the best percentage change in target lesion determined by RECIST 1.1 for all evaluable patients (N=55), and the dashed lines at 20% and -30% represent the progressive disease and partial response, respectively; (B) the best percentage change of CA19-9 in evaluable patients who had an elevated CA19-9 at baseline (N=52). Abbreviation: CR, completed response; PR, partial response; SD, stable disease; PD, progressive disease; NA, not available.

