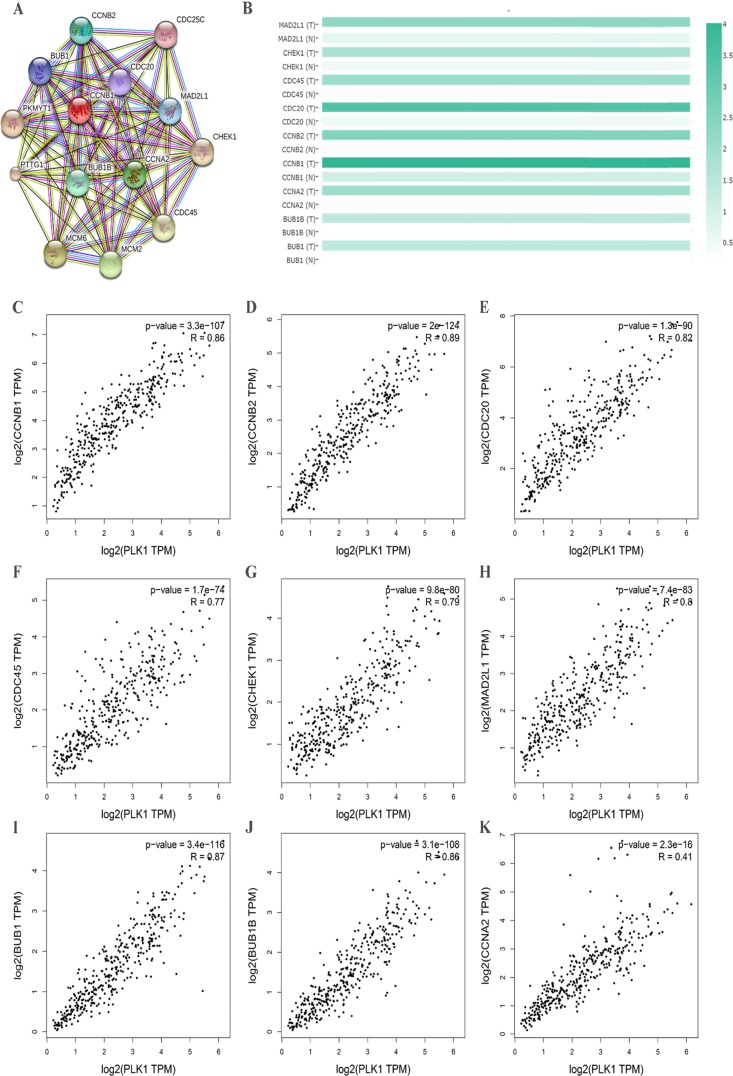
Figure 15. Protein-protein interaction (PPI) network of several related genes enriched in cell cycle pathway.
(A) PPI network was drawn using STRING online tool. (B) Plots of nine hub genes drawn by GEPIA online tool. The density of color in each block represented the median expression value of a gene. (C-K) Scatter plot showed the correlation between the PLK1 expression and the nine hub genes signature.

