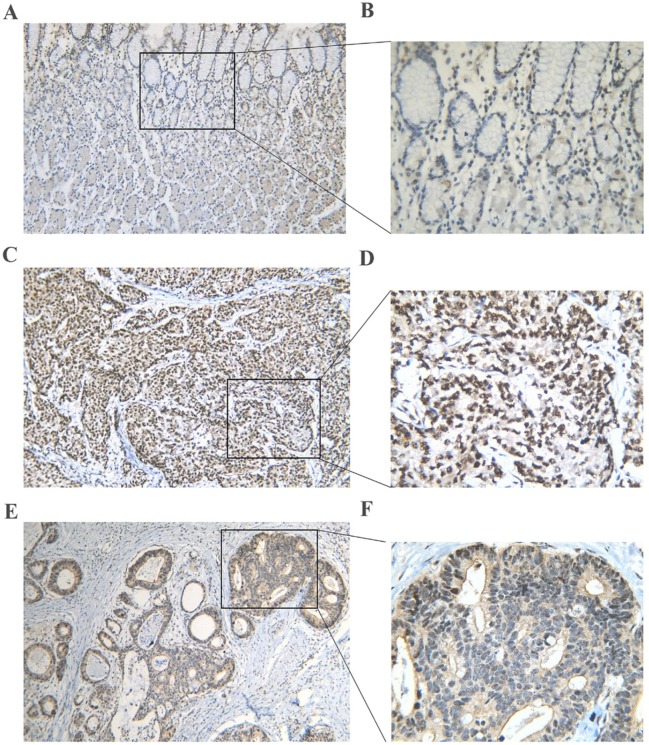
Figure 6. PLK1 protein expression in gastric cancer and non-tumor tissues assessed by immunohistochemistry.
(A, B) A normal gastric tissue showing low PLK1 expression. (C, D) A poorly differentiated tumor tissue showing high PLK1 expression. (E, F) A well differentiated tumor tissue showing high PLK1 expression. Magnification: ×100 (A, C, E) or ×400 (B, D, F).

