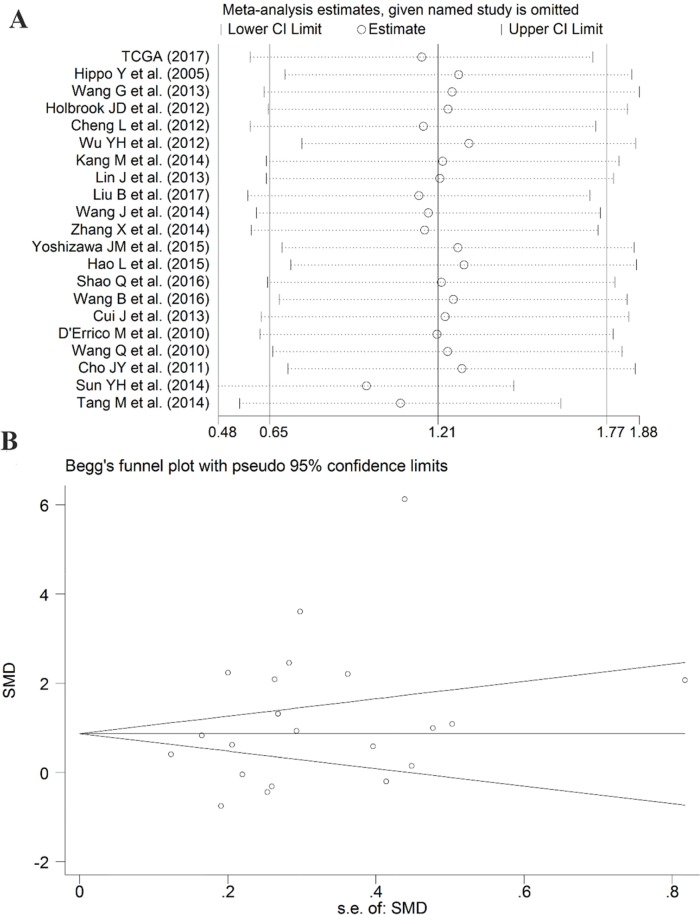
Figure 9. Results of the sensitivity analysis and Begg's funnel plot of PLK1 expression.
(A) Sensitivity analysis of standard mean deviation (random effects model) based on stepwise omitting one study at a time. (B) Analysis of the detection of publication bias in the meta-analysis of studies assessing the expression pattern of PLK1 in gastric cancer.

