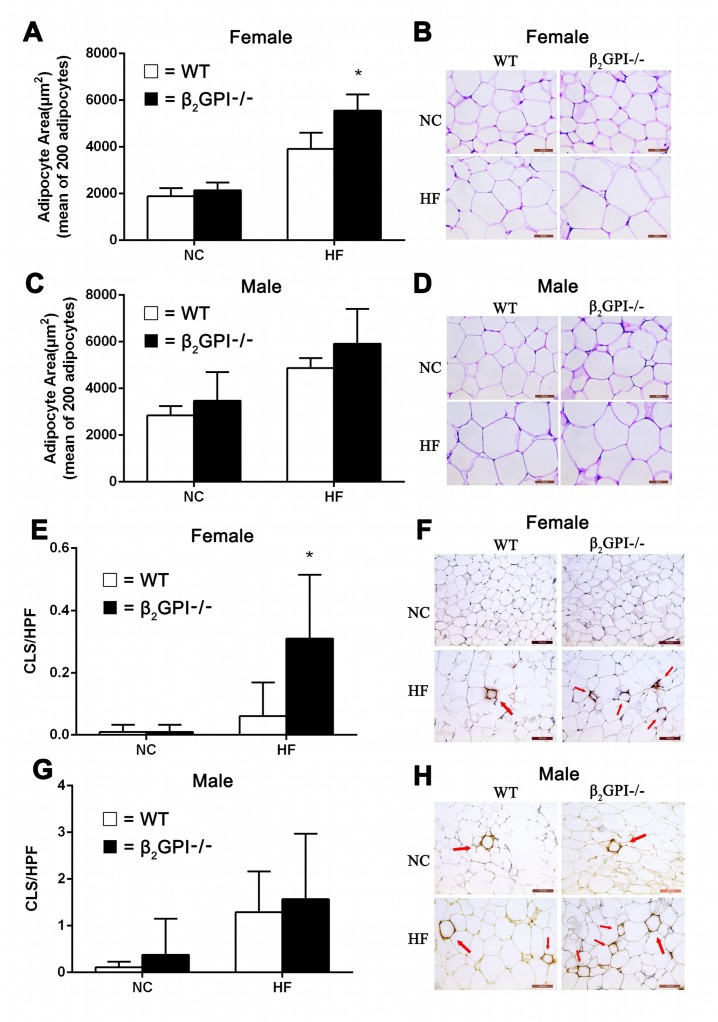
Figure 3. Visceral adipocyte size and infiltration of VAT detected by MAC-2 staining in β2GPI-/- and WT mice fed NC or HF diet for 16 weeks.
Female (A, B) and male (C, D) adipocyte area and representative images of adipocyte morphology. Female (E, F) and male (G, H) crown-like structures (CLS) per high power field and representative images of macrophage infiltration of VAT. Scale bar is 50 μm. Adipocyte area is shown as mean ± SD (n = 5 mice per group, 200 cells per mouse). Number of CLS indicated by arrows in VAT was calculated as numbers per high power field in 20 high-power fields (magnification 200×). *p < 0.05. □ = WT, ■ = β2GPI-/-, NC = normal chow, HF = high fat.

