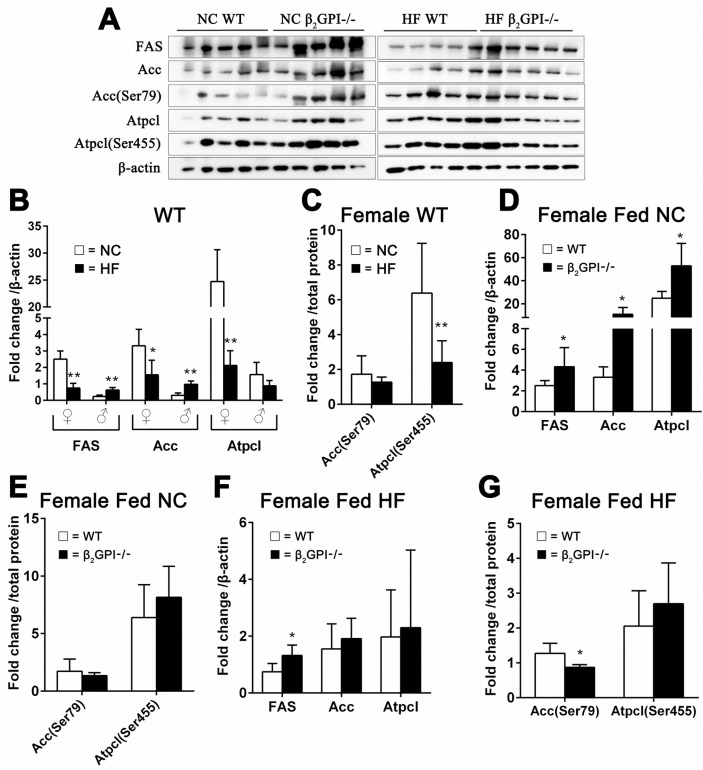
Figure 4. Effect of β2GPI deficiency on VAT lipogenesis enzyme levels.
(A) Western blot analysis of VAT proteins. Quantification of the scanned images normalized to β-actin (B, D, F) and to total protein (C, E, G). Panels (B) WT mice fed a HF diet compared to WT mice fed NC. □ = NC, ■ = HF diet. ♀ = female, ♂ = male. (C) Phosphorylation of Acc (Ser79) and Atpcl (Ser 455) as a ratio of the total protein level from (B) for female mice. □ = NC diet, ■ = HF diet. (D) Female β2GPI-/- mice fed a NC diet compared to female WT mice fed a NC diet. □ = WT, ■ = β2GPI-/-. (E) p-Acc (Ser79/Acc) and p-Atpcl (Ser455). (F) Fas Protein, Acc and Atpcl. (G) Phosphorylation of Acc (Ser79) and Atpcl (Ser455) as a ratio to the total protein level from (F). □ = WT, ■ = β2GPI-/-.

