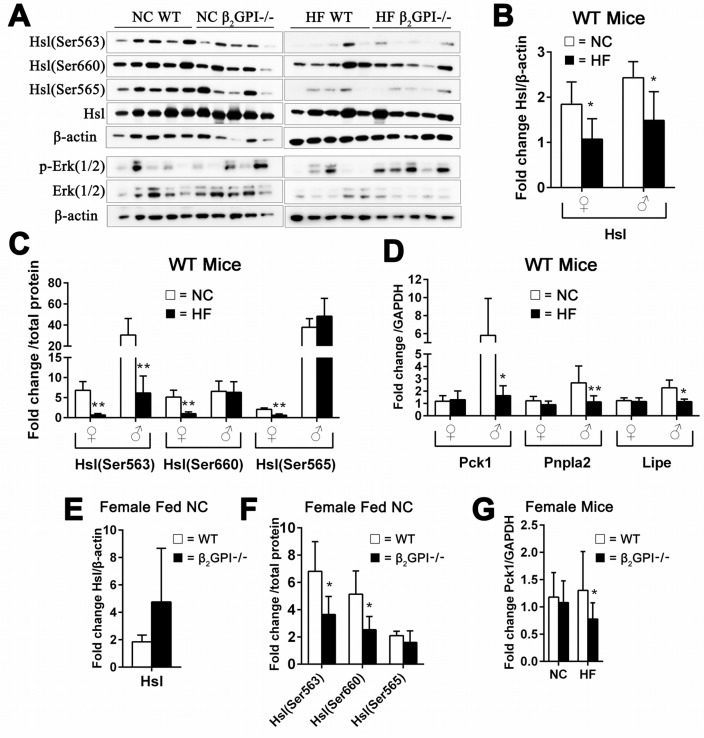
Figure 5. Effect of β2GPI deficiency on VAT lipolysis enzyme activation.
(A) Western blot analysis of lipolysis enzymes in VAT of female mice. (B) Hsl – total and (C) is phosphorylation of Hsl (Ser563), Hsl (Ser660) and Hsl (Ser565). □ = NC diet, ■ = HF diet. (D) mRNA levels of Pck1, Pnpla2 and Lipe. □ = NC diet, ■ = HF diet. ♀ = female, ♂ = male. (E) Total Hsl and (F) phosphorylated Hsl (Ser563), Hsl (Ser660) and Hsl (Ser565) in female β2GPI-/- and female WT mice fed a NC diet. □ = WT, ■ = β2GPI-/-. (G) mRNA levels for Pck1 in female β2GPI-/- and female WT mice fed a NC and HF diet. □ = WT, ■ = β2GPI-/-.

