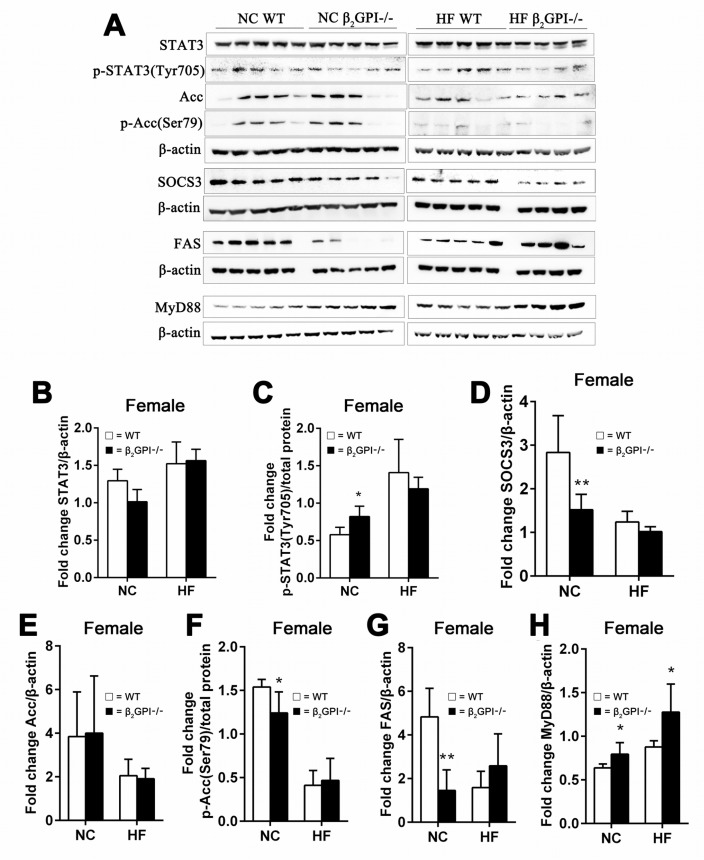
Figure 8. β2GPI deficiency and the hypothalamic appetite signaling pathways.
(A) Western blot analysis of hypothalamic proteins in female mice. (B-H) quantification of the immunoreactive bands (B) STAT3, (C) p-STAT3 (Tyr705) (D) SOCS3, (E) Acc, (F) p-Acc(Ser79), (G) FAS/β-actin and (H) MyD88. □ = WT, ■ = β2GPI-/-, NC = normal chow, HF = high fat. Data are expressed as mean ± SD (n = 4-5 mice per group). *p < 0.05. **p < 0.01.

