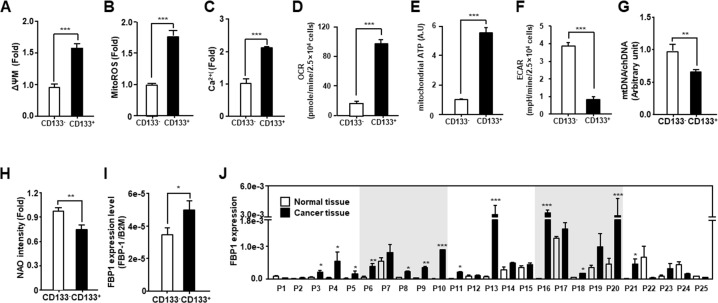
Figure 1. Comparison of mitochondrial function in endometrial CSCs (CD133+) and non-CSCs (CD133−).
(A-F) Mitochondrial membrane potential (A), mitochondrial ROS levels (B), calcium levels (C), OCR (D), mitochondrial ATP levels (E), and ECAR (means relative to lactic acid production (F) measured in CD133+ and CD133− sorted cells from the Ishikawa endometrial cancer cell line. ECAR, extracellular acidification rate. Mitochondrial ATP levels are measured by quantifying the luciferase-catalyzed, ATP-dependent oxidation of luciferin in endometrial CSCs and non-CSCs. (G) Mitochondrial DNA content calculated from the ratio of mitochondrial DNA to chromosomal DNA, measured by qPCR using primers specific to the mitochondrial D-loop, and chromosomal β2-microglobulin (B2M) gene. (H) Mitochondrial content measured by fluorescence-activated analysis in CD133+ and CD133− cells stained with nonyl acridine orange (NAO) dye. (I) qRT-PCR analysis of FBP1 levels, which are related to glycolysis and gluconeogenesis, in CD133+ and CD133− cells isolated from Ishikawa cells. (J) Transcript levels for FBP1 in 25 pairs of tissues from human patients with EC, measured by qRT-PCR. FBP1 levels are calculated using standard methods, after normalizing against the B2M level in each sample.

