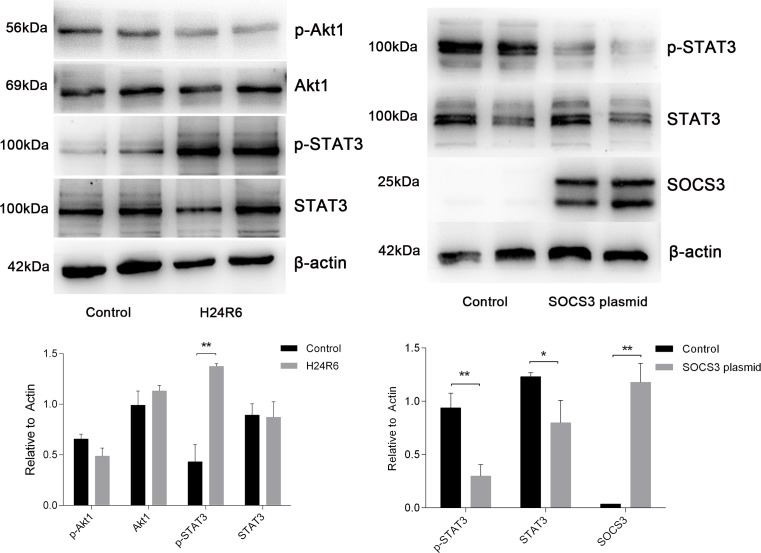
Figure 11. STAT3 was activated in response to cellular H/R injury and was inhibited in cells overexpressing SOCS3.
(Left) Protein levels of STAT3, p-STAT3, Akt and p-Akt were analyzed in the H/R model. (Right) Protein levels of STAT3 and p-STAT3 were analyzed in SOCS3 overexpression group. β-Actin was used as the internal control. The data are expressed as the mean±S.E.M, n=3, *P<0.05, **P<0.01 compared with the control group.

