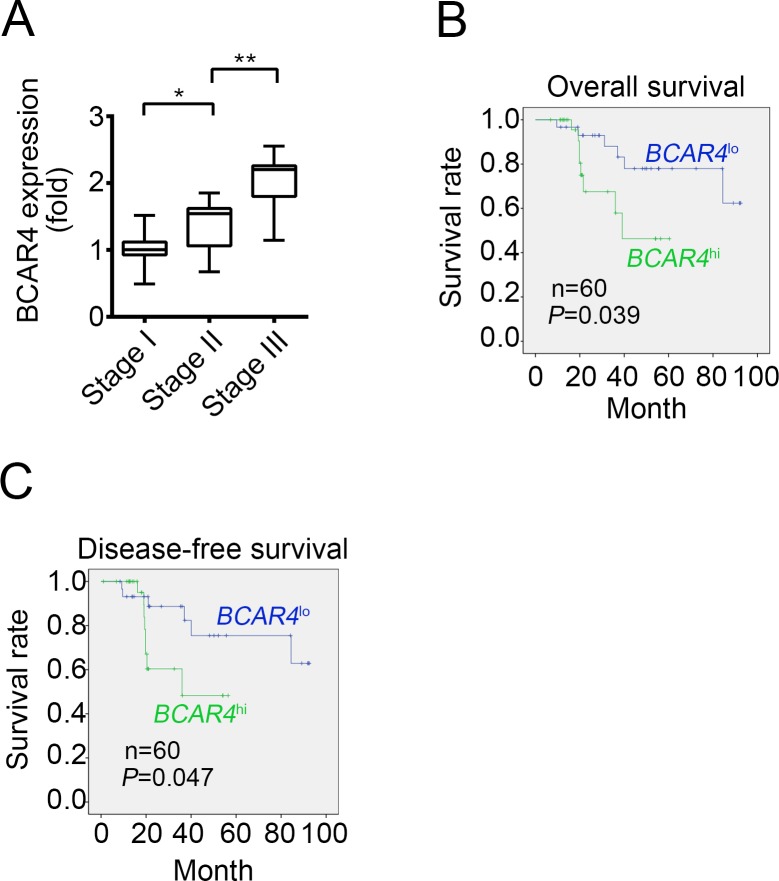
Figure 2. High BCAR4 expression correlates with a poor survival rate.
(A) Thirty CC samples were divided into 3 groups of Stage I, Stage II and Stage III. Then the expression levels of BCAR4 were examined in each group by RT-qPCR. Fold changes were normalized to endogenous ACTB. (B and C) Sixty CC samples were divided into two groups based on their expression levels. Then overall-survival rate (B) and disease-free survival rate (C) were analyzed by Kaplan–Meier survival analysis. *P<0.05 and **P<0.01 by two-tailed Student's t test. All data were collected from three independent experiments.

