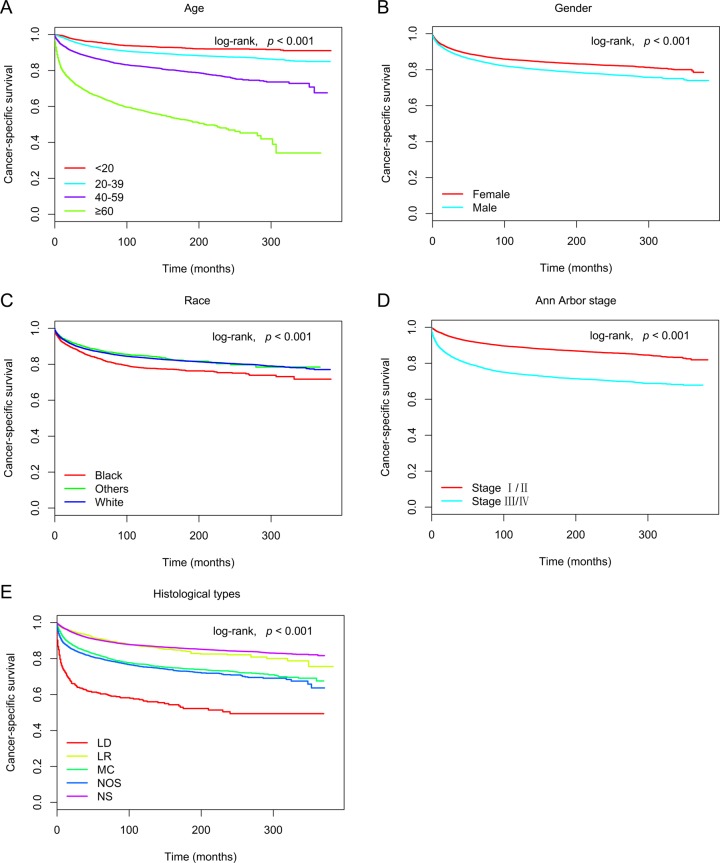
Figure 2.
Kaplan-Meier survival curves for cancer-specific survival in the training cohort, as stratified by (A) age (log-rank, χ2 = 3.36E+03, p < 0.001), (B) gender (log-rank, χ2 = 7.98E+01, p < 0.001), (C) race (log-rank, χ2 = 5.24E+01, p < 0.001), (D) Ann Arbor stage (log-rank, χ2 = 1.00E+03, p < 0.001), and (E) histological type (log-rank, χ2 = 9.50E+02, p < 0.001). Abbreviations: LD, lymphocyte-depleted; LR, lymphocyte-rich; MC, mixed cellularity; NOS, not otherwise specified; NS, nodular sclerosis.

