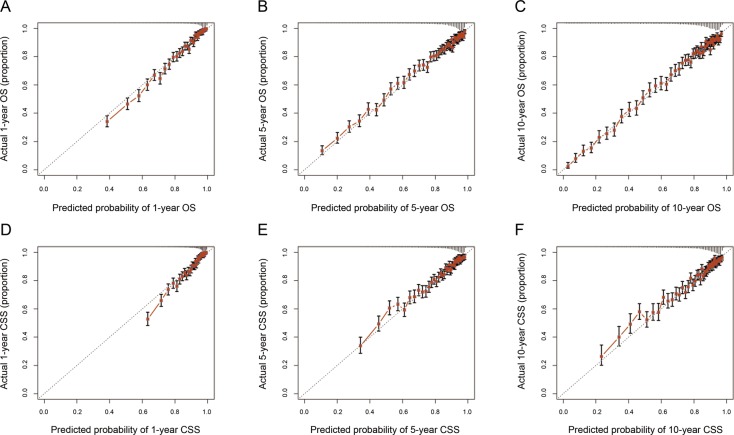
Figure 4.
The calibration curves for predictions of overall survival (A-C) and cancer-specific survival (D-F) in the training cohort at 1, 5, and 10 years after diagnosis. The dashed line represents perfect agreement between the nomogram-predicted probability (x-axis) and the actual probability calculated from a Kaplan-Meier analysis (y-axis). A perfectly accurate nomogram prediction model would result in a plot where the actual and predicted probabilities, for the given groups, fall along the 45° line. The distance between the pairs and the 45° line is a measure of the absolute error of the nomogram's prediction. Abbreviations: OS, overall survival; CSS, cancer-specific survival.

