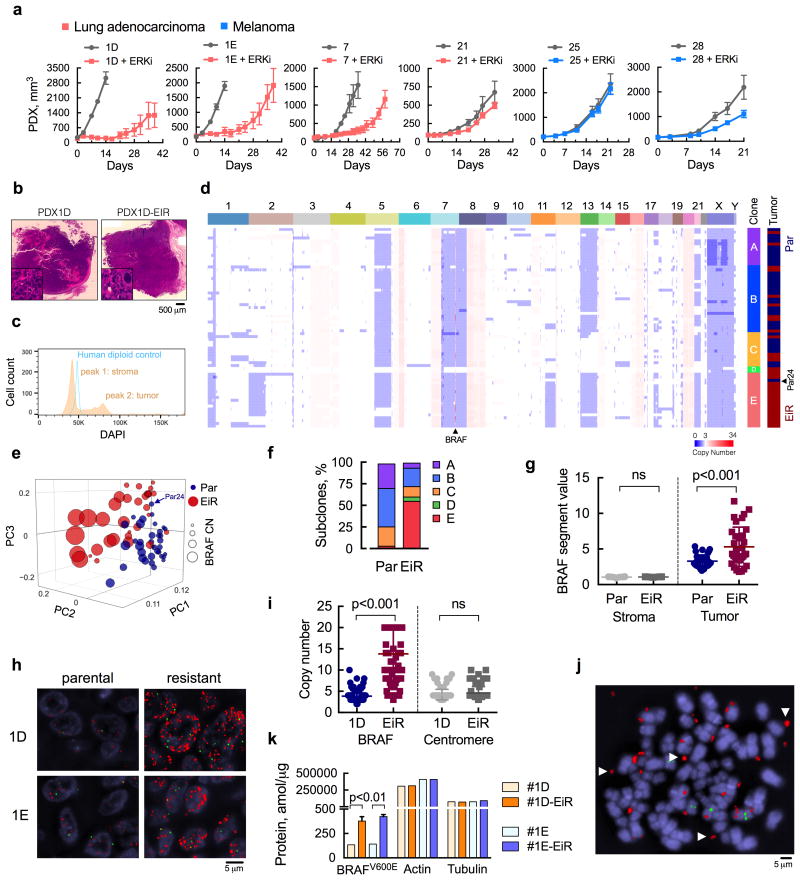
Figure 1. ERK inhibitor-resistant populations with extrachromosomal BRAF amplification.
(a) Patient-derived xenograft (PDX) models from patients with BRAFV600E-mutant lung cancer or melanoma were treated with ERK inhibitor (ERKi) SCH984 over time (n = 5 mice, mean ± s.e.m). (b) H&E stained sections of the PDX models before and after ERKi treatment. (c) Single nuclei extracted from PDX1D tumors were analyzed by FACS to determine the distribution of cells according to their DNA content. A human diploid cell line was used as a control. (d) Copy number (CN) profiles of 69 single cells derived from parental (Par) and ERK inhibitor-resistant (EiR) PDX-1D tumors. (e), Projection of single cells into the top three principal components. (f) Subclonal distribution of parental and resistant tumors. (g) Segment values spanning the BRAF locus in tumor and stromal cells. For stromal cells, sequenced reads were mapped to the mouse genome (see Supplementary Fig. 1e). (h) Representative images of fluorescence in situ hybridization (FISH) analysis with probes spanning BRAF or chr7 centromere in red or green, respectively (a representative of five different fields is shown). (i) Probes were quantified by manual counting (n = 100 cells, all data are shown). (j) Representative image of extra-chromosomal localization of the BRAF gene (arrows) in an 1D-EiR cell undergoing metaphase. (k) The expression of BRAFV600E protein in matched PDX1D and 1E tumor sets was determined by mass spectrometry (n = 3, mean ± s.e.m). Actin and tubulin were used as controls.

