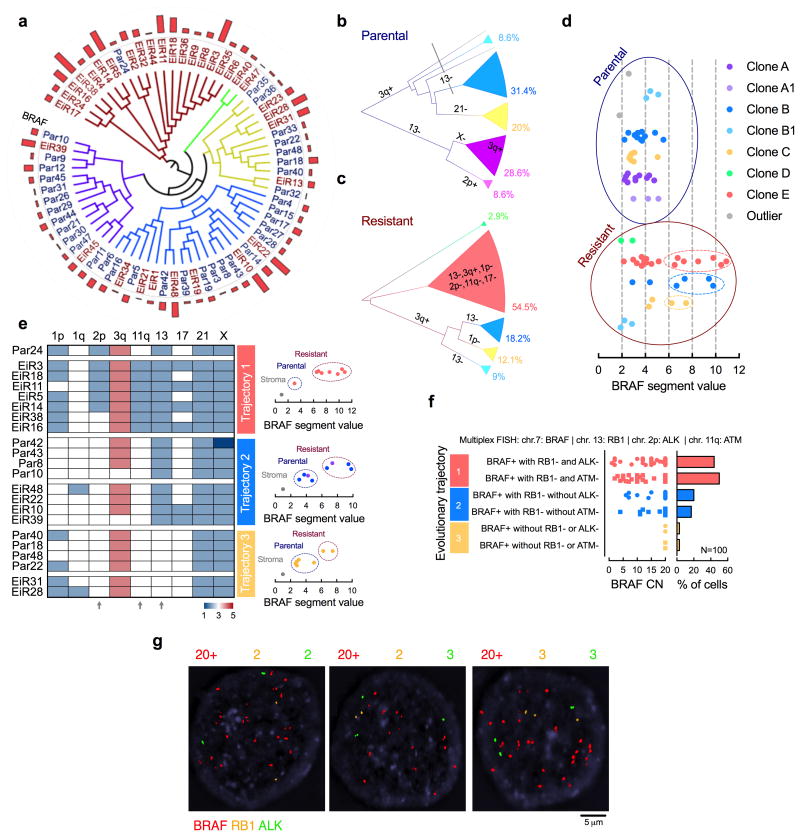
Figure 2. BRAFamp emerges in parallel evolutionary tracts.
(a) The clonal relationship of single cells, as inferred by Manhattan-Ward clustering of integer CN. The bar graph shows BRAF CN. (b, c) Single cells derived from parental (b) or resistant (c) tumors were subjected to hierarchical clustering and subclonal analysis independent of each other. Phylogenetic inference was established using a heuristic maximal parsimony approach. Subclones A and B were subdivided on the basis of additional CN alterations and their inferred phylogeny. (d) Single cells with high-level BRAFamp were found in three distinct resistant clones. (e) The CN state of select chromosomal regions with heterogeneous profiles. Note the emergence of BRAFamp cells in three distinct evolutionary trajectories depending on co-occurring losses in chr2p, 11q and/or 13 (arrows). (f, g) Multiplex FISH with probes targeting the indicated chromosomal regions in PDX1D-EiR. Manual quantification (f) and representative images (g) are shown.

