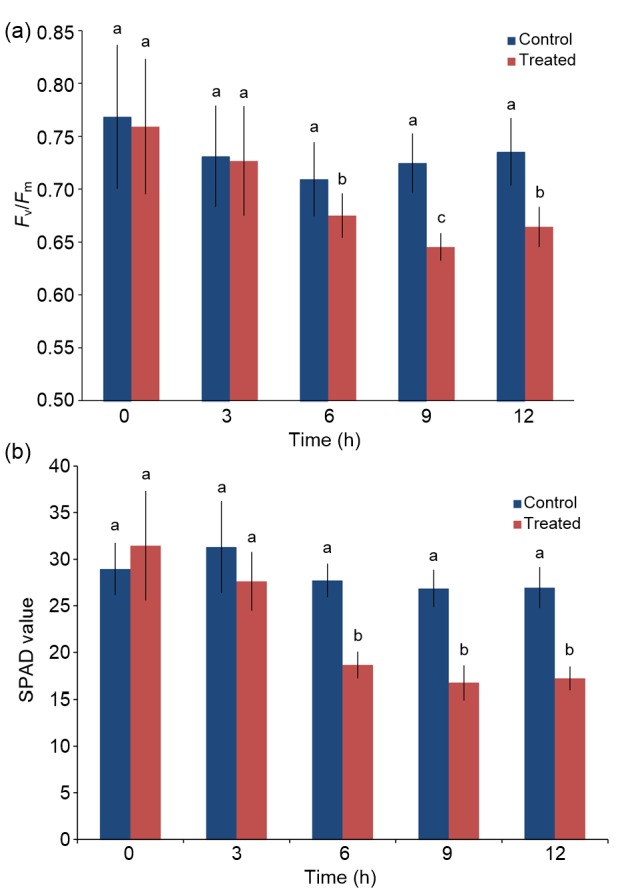
Fig. 1.

Effects of saline-alkaline mixed stress on chlorophyll fluorescence and chlorophyll content
(a) Time course of photosynthetic efficiency (F v/F m) for the control and treated samples. (b) Chlorophyll content (SPAD value) of the control and treated samples. Values are represented as mean±standard error (n=10). Different letters present statistical difference (P<0.05)
