Fig. 3.
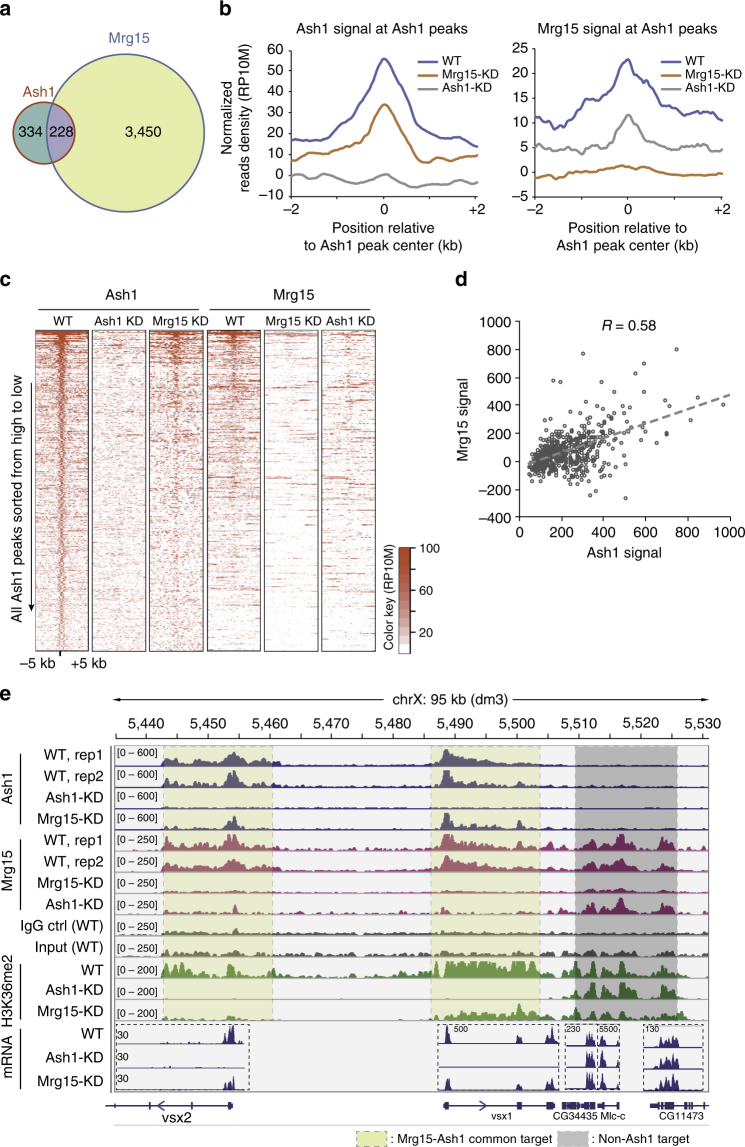
Ash1 co-localizes with Mrg15 and recruits Mrg15 to their common target genes. a Venn diagram show the overlap between Ash1 and Mrg15 peaks. b Profiles of average normalized read densities (RP10M) show the Ash1 (left panel) and Mrg15 (right panel) occupancy around Ash1 peaks in wild type and in Mrg15 knockdown cells. RP10M, reads per 10 million reads. c Heat maps show the occupancy of Ash1 and Mrg15 around Ash1 peaks in wild type, Ash1 knockdown and Mrg15 knockdown cells. Peaks are sorted according to Ash1 reads densities in wild-type cells. d Scatter plot shows the correlation between Ash1 and Mrg15 intensities at all Ash1 peaks. e Genome browser tracks show the binding of Ash1 and Mrg15, H3K36me2, and RNA-seq signals at several representative genes

