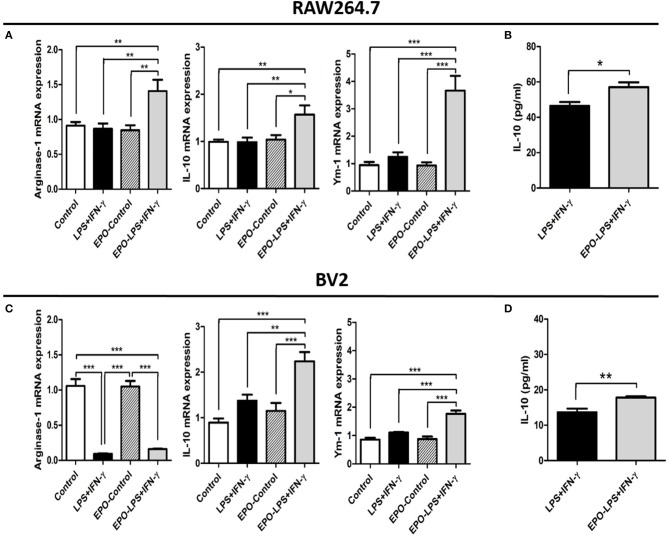
Figure 5.
In vitro evaluation of the M2 phenotype in RAW 264.7 and BV2 cells after LPS+IFN-γ treatment. The mRNA expression levels of selected M2-related genes in RAW 264.7 (A) and BV2 (C) cells. IL-10 protein expression in RAW 264.7 (B) and BV2 (D) cell supernatants. β-actin was used for normalization. *P < 0.05, **P < 0.01, and ***P < 0.001.

