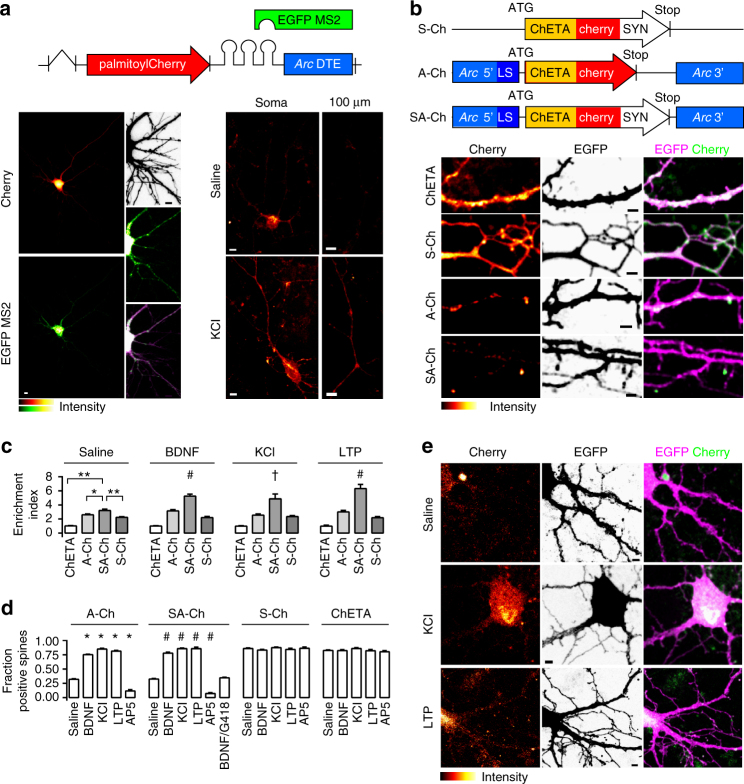
Fig. 1.
Activity-dependent SA-Ch expression at spines. a Schematic construct of palmitoyl-Cherry/MS2 reporter. Left, Cherry (top) and EGFP-MS2 (bottom) distribution in living neurons under resting conditions. In the presence of Arc DTE, MS2/RNA signal is granular. Inset, top to bottom, neuron profile, EGFP-MS2, merge (stretched levels). Right, Arc DTE regulates reporter expression in response to neuron activity. Cherry expression in proximal dendrites (“soma”) and 100 μm away from the soma (“100 μm”) after 1 h saline (top) or 10 mM KCl (bottom) treatment. b Schematic S-Ch, A-Ch and SA-Ch constructs. Below, dendritic pattern of ChETA-Cherry expression (left), EGFP filler (centre) and merge (right) for unmodified ChETA-Cherry and the three constructs above. c Enrichment Index for the three constructs and unmodified ChETA-Cherry under different stimulation conditions (see Methods). *P < 0.01 and **P < 0.001, one-way ANOVA, Bonferroni comparison of means, within group. †P < 0.05 and #P < 0.001 to SA-Ch, saline treated, one-way ANOVA, Bonferroni comparison of means. d Fraction of ChETA-Cherry-expressing spines under different stimulation conditions, grouped for construct. *P < 0.001 to A-Ch saline and #P < 0.001 to SA-Ch saline, one-way ANOVA, Bonferroni comparison of means. Differences within and between S-Ch and ChETA values are not significant at the 0.05 level. e Representative images of SA-Ch-expressing neurons under different treatment conditions. Following KCl or NMDA-dependent LTP, bright ChETA-Cherry puncta are evident along dendrites. Bars are mean ± SEM. Data in d and e are reported as boxplots in Supplementary Fig. 5. Scale bar (a) 5 μm, (b,e) 2 μm. N and replicate numbers for all figures are listed in Supplementary Table 1

