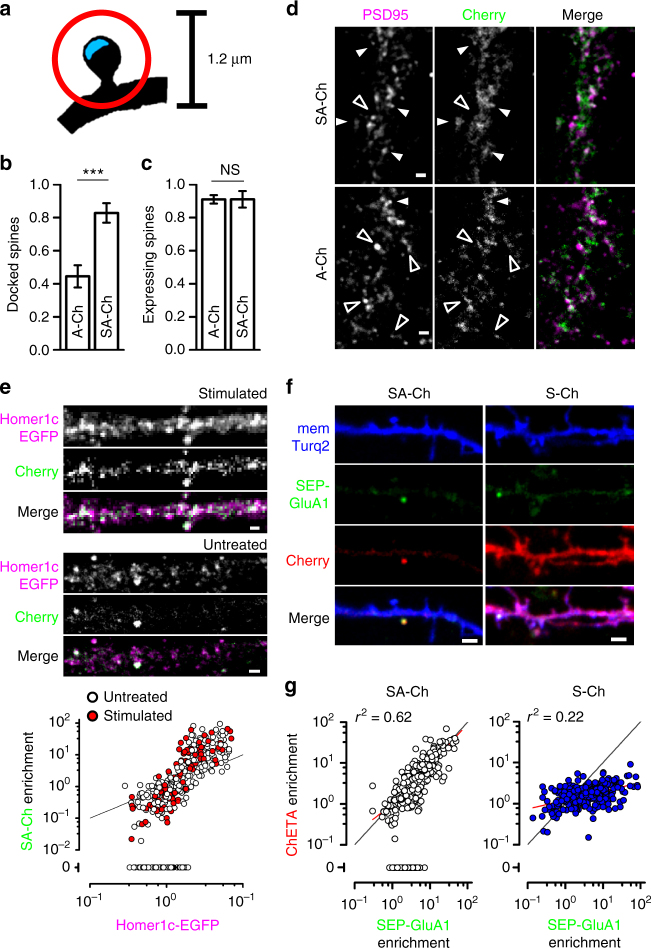
Fig. 2.
Synergistic action of RNA and protein regulatory sequences. SYN tag confers synaptic localization of SA-Ch protein (a–d), whereas RNA sequences maps its expression to potentiated spines (e–g). a Schematic drawing for the determination of “docked” vs. positive but non-“docked” spines. Cherry fluorescence peaks within a circle of 1.2 μm diameter (red circle) centered on the postsynaptic density (PSD - blue area) for positive spines, and on the PSD for “docked” spines. Quantification of “docked” b and total positive spines (c following cLTP treatment (see Methods) for A-Ch and SA-Ch. Bars are mean ± SEM. ***P < 0.001 two-tailed Student’s t-test. NS, not significant at the α = 0.05 level. d Representative dendrites of neurons expressing the two constructs. White arrowheads indicate “docked” spines, empty arrowheads positive, non-“docked” spines. Another example is reported in Supplementary Fig. 7a. e SA-Ch co-localizes with PSD marker Homer1c-EGFP. In stimulated as well as in unstimulated neurons, SA-Ch was expressed at Homer1c-EGFP puncta (top). SA-Ch correlation with Homer1c-EGFP is supralinear, indicating that SA-Ch is preferentially enriched at spines with larger PSD (bottom graph). Spines that do not express SA-Ch are assigned a value of zero. White dots are spines from unstimulated neurons, red dots from stimulated ones, black line represents the diagonal. Because the plot has double-log scale, any linear correlation has unitary slope and is parallel to this line. f Comparison of SA-Ch and S-Ch expression: SA-Ch is only expressed at SEP-GluA1-tagged spines, whereas S-Ch has no preference for SEP-GluA1-positive spines. g SA-Ch (grey dots) significantly correlates with SEP-GluA1 expression in a linear fashion, whereas S-Ch (blue dots) does not. A proportion of SEP-GluA1-positive spines do not express SA-Ch and those spines are assigned an enrichment value of zero. Red lines indicate the regression lines. Scale bar, 1 μm (d, e) and 2 μm (f)

