Fig. 4.
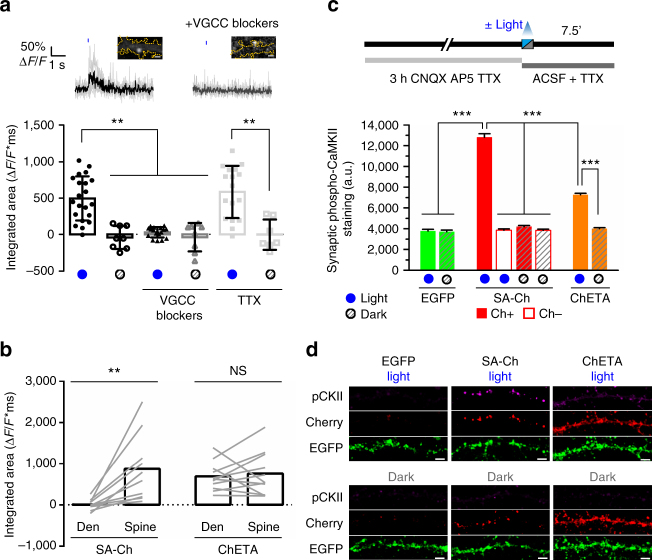
Optogenetic activation of SA-Ch in neurons. a Activation of SA-Ch by means of 488 nm laser illumination drives calcium influx in the neuron. GCaMP6s was expressed along with SA-Ch and illuminated at 990 nm. Top, example of GCaMP6s ΔF/F time course following 10 ms light stimulation (blue mark above) in ACSF (left, black trace) or in ACSF with voltage-gated calcium channel (VGCC) blockers nifedipine, Ni2+, and Zn2+ (right, gray trace). Single traces are in light gray and bold lines are the average. Above images show SA-Ch fluorescence in corresponding spines and yellow dotted trace shows neuron profile as inferred from GCaMP6s fluorescence; scale bar, 1 μm. Bottom, integrated area of ΔF/F against time plot after light stimulation for imaged spines with (blue dots below) or without (gray dots) light stimulation. SA-Ch neurons were recorded in standard ACSF (black, circles) or in ACSF in the presence of either VGCC inhibitors (dark gray, triangles) or TTX (light gray, squares); open symbols represent recordings in the same medium as corresponding filled symbols, without illumination. Data are values for single spines, each represents the average of trains on the same spine, bars are mean ± SD. **P < 0.01, Kruskal–Wallis test, Dunn’s post-hoc comparisons. b Illumination of spines in SA-Ch-expressing neurons drives calcium influx, but not when laser illumination is focused on the nearby dendrite. Conversely, ChETA neurons can be excited both by a spine-focused and a dendrite-focused laser beam. **P < 0.01 paired Student’s t-test, two-tailed. NS, not significant at the α = 0.05 level. Lines connect single paired data points, bars are mean. c Outline of time course of the experiment. Cells were pretreated for 3 h with CNQX, AP5, and TTX, to reduce background CaMKII activation. Neurons were fixed 7.5 min after light stimulation and stained for phospho-CaMKII. Spines in SA-Ch-expressing neurons were subgrouped into Cherry-positive (filled bars) and Cherry-negative spines (empty bars). Light stimulation induced a significant increase of phospho-CaMKII staining in SA-Ch-expressing spines ***P < 0.001, one-way ANOVA, Bonferroni comparison of means. Bars are mean ± SEM. d Representative images of data shown in c. Panels show phospho-CaMKII immunofluorescence (p-CKII), anti-Cherry immunofluorescence (Cherry), and EGFP signal. Scale bar, 5 μm

