Fig. 5.
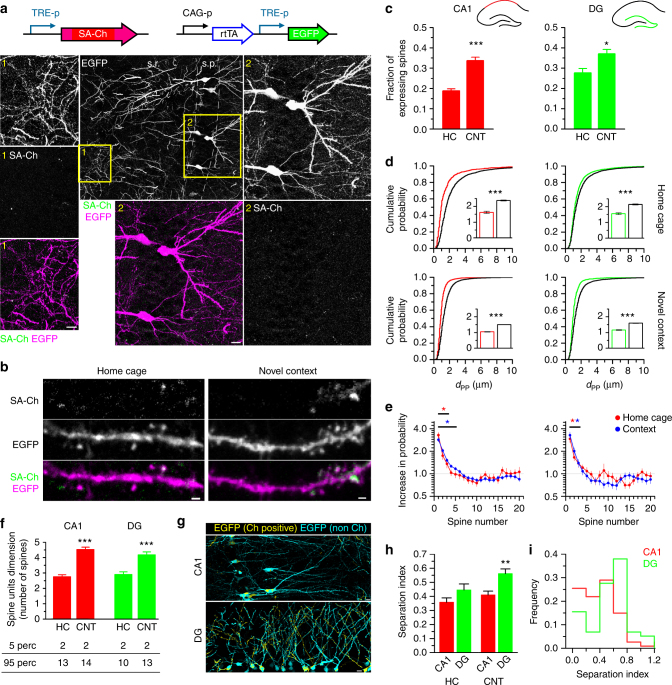
In vivo synaptic tagging. a Constructs expressed in the hippocampus of electroporated mice. TRE-p is the tetracycline-responsive promoter. Expression of SA-Ch in mouse CA1 after 2d intraperitoneal doxycycline injection. Dendritic (1) and somatic (2) regions (yellow squares in the large-field image) are magnified, showing EGFP, SA-Ch, and merge channels (SA-Ch: green, EGFP: magenta). s.p. stratum pyramidale, s.r. stratum radiatum. b Dendrites expressing SA-Ch in pyramidal neurons in CA1 from animals held in the home cage or exposed to a novel context (see text). c Average fractions of SA-Ch-positive spines in CA1 and DG neurons in home cage (HC) and novel context (CNT) groups. *P < 0.05, ***P < 0.001, Student’s t-test, two-tailed. d Distribution of first neighbor distance (d PP) for two potentiated spines in CA1 (left) and in the DG (right). Graphs on the top represent data from home-caged animals, bottom graphs from animals exposed to a novel context. Black lines are the corresponding distributions after randomly shuffling positive/negative assignments to the original spine positions. Insets show, with corresponding colors, first neighbor distance mean ± SEM. ***P < 0.001 Kruskal–Wallis test, followed by Dunn’s comparison. e Measured increase in estimated probability to be potentiated themselves for the first 20 neighbors of a potentiated spines in CA1 (left panel) and DG (right panel) neurons. Under the assumption of random distribution of potentiated spines, this value should be 1 uniformly. *P < 0.01, z-test from the reference value of 1. Points are mean ± SEM. f Mean number of spines per unit (cluster and single spines). Bottom table represents the 5th and 95th percentiles of cluster dimension. ***P < 0.001 Kruskal–Wallis test, Dunn’s comparison. Bars are mean ± SEM. g Localization of SA-Ch-positive regions (yellow) and SA-Ch-negative region (cyan). Original images are in Supplementary Fig. 12. h Separation index (see text for details). A large separation index value indicates that the number of potentiated spine in the dendrite strongly deviates from the expected value if potentiated spines were equally distributed in neurons from the same slice. **P < 0.01 Kruskal–Wallis test, Dunn’s comparison. i Separation index distribution of dendrites in CA1 and the DG in context-exposed animals. Scale bar, 10 μm (a, g) and 1 μm (b)

